Fig. 5.
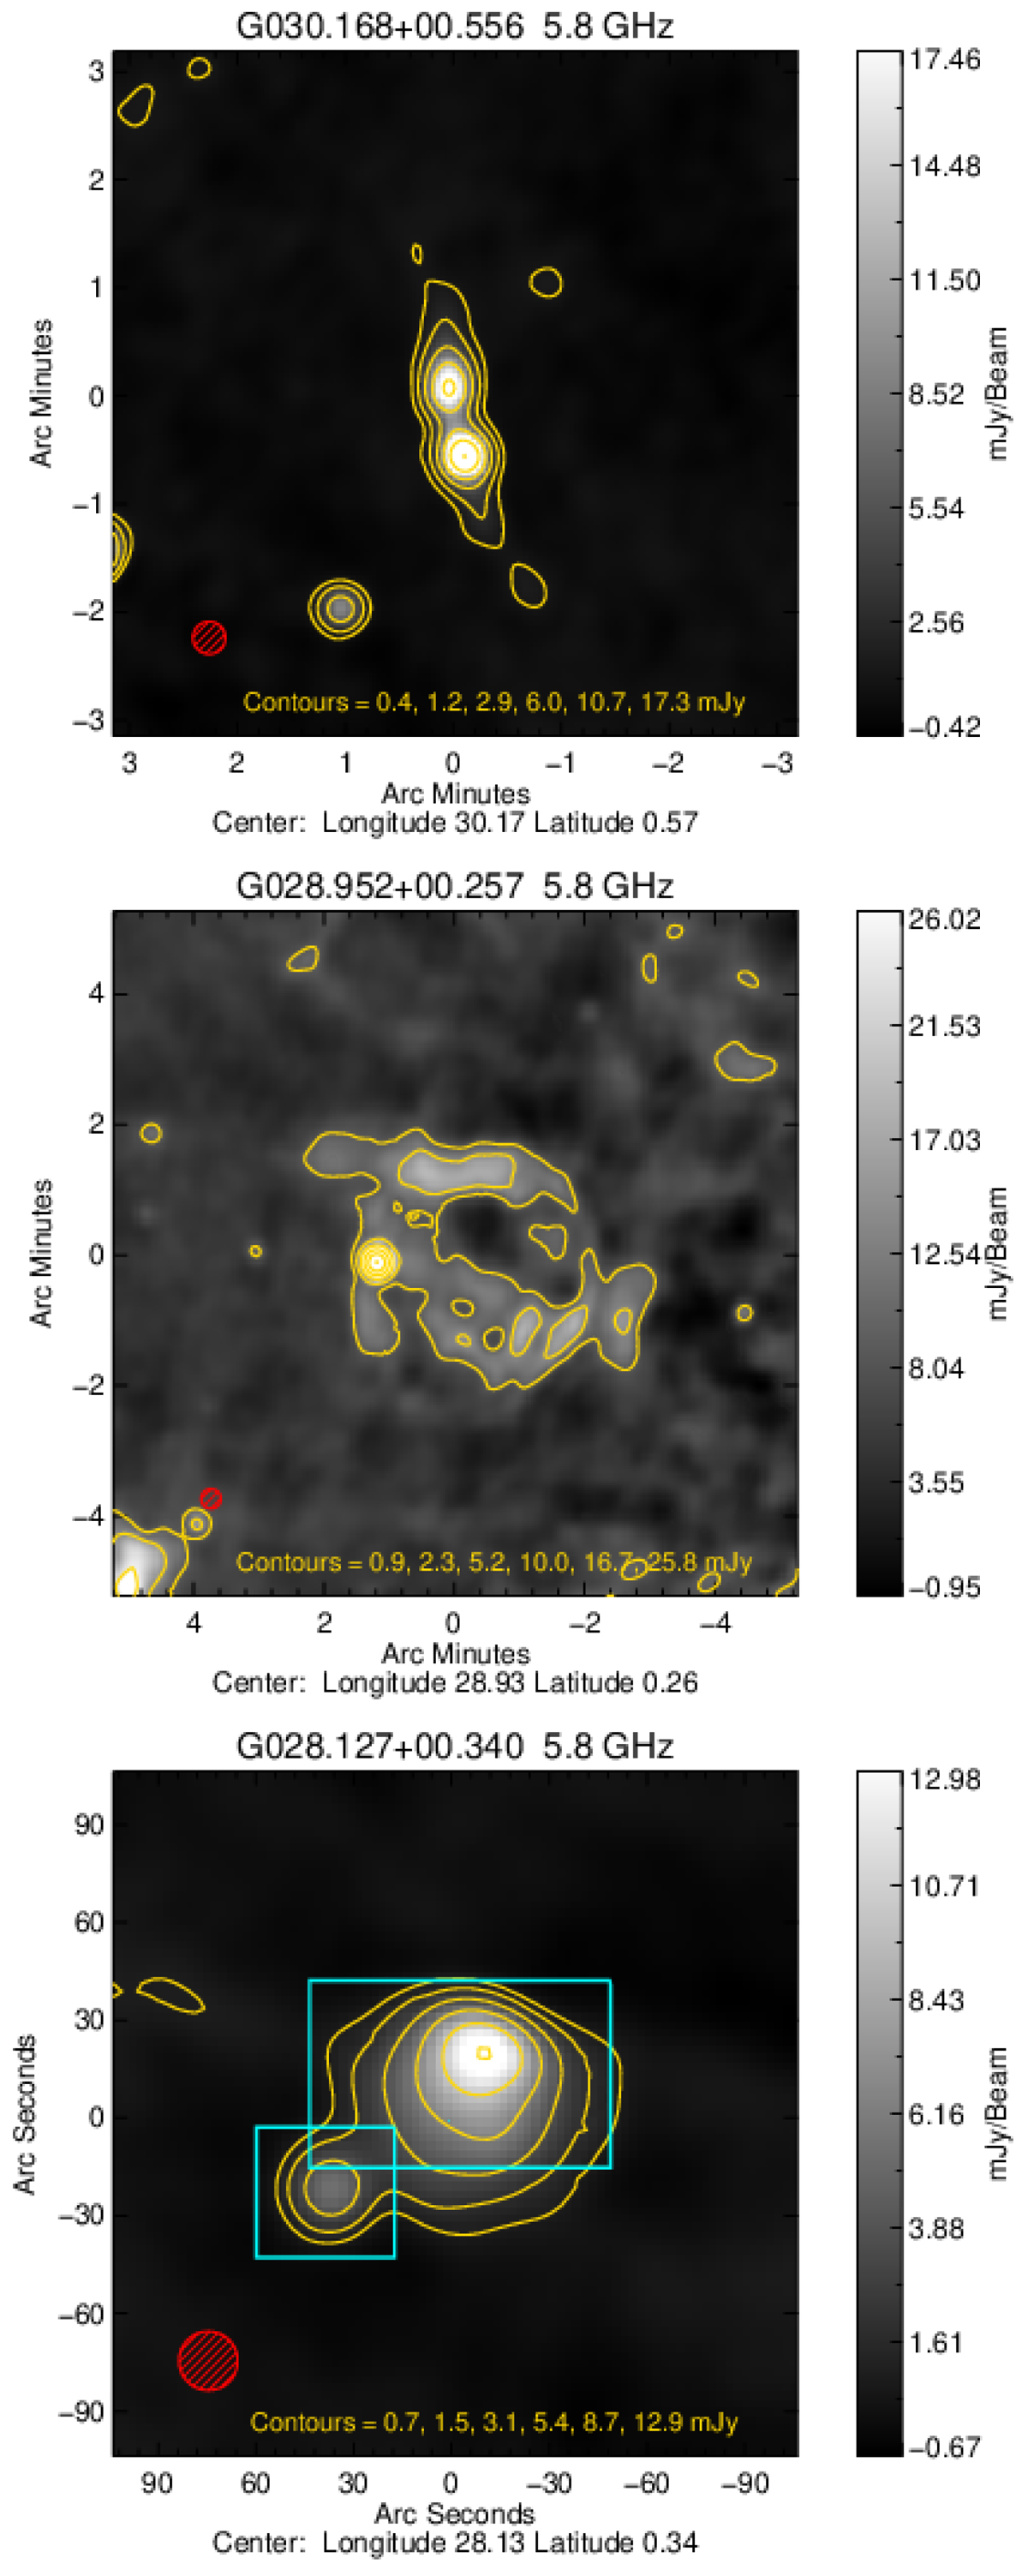
Examples of various types of radio sources (see text). The contour levels start at 3σ and increase in steps determined using the dynamic range power-law fitting scheme where D = Ni + 3, where D is the dynamic range, Speak/σ, N is the number of contours, in this case six, and i is the power law that determines the separation between consecutive contours; this is a modified version of a scheme developed by Thompson et al. (2006). The red hatched circle shown in the lower left corner of the map indicates the GLOSTAR beam size. The cyan boxes indicate the two sources identified and the region from which the flux has been estimated.
Current usage metrics show cumulative count of Article Views (full-text article views including HTML views, PDF and ePub downloads, according to the available data) and Abstracts Views on Vision4Press platform.
Data correspond to usage on the plateform after 2015. The current usage metrics is available 48-96 hours after online publication and is updated daily on week days.
Initial download of the metrics may take a while.