Open Access
Fig. 22.
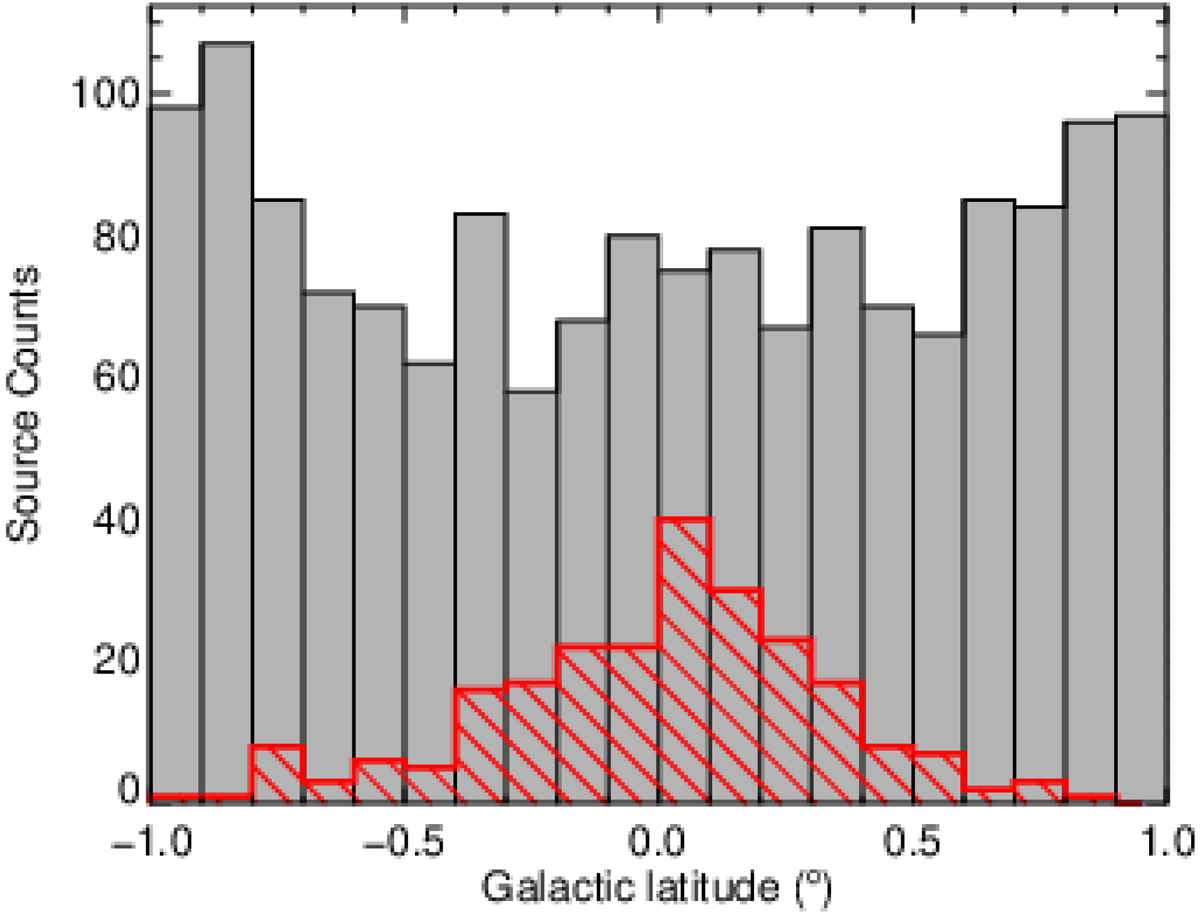
Distribution of GLOSTAR radio sources as a function of Galactic latitude. The whole catalog is shown as the gray histogram, while the sources identified as H II regions are shown as the hatched red histogram. The bin size used for both distributions is 0.1°.
Current usage metrics show cumulative count of Article Views (full-text article views including HTML views, PDF and ePub downloads, according to the available data) and Abstracts Views on Vision4Press platform.
Data correspond to usage on the plateform after 2015. The current usage metrics is available 48-96 hours after online publication and is updated daily on week days.
Initial download of the metrics may take a while.