Fig. 21.
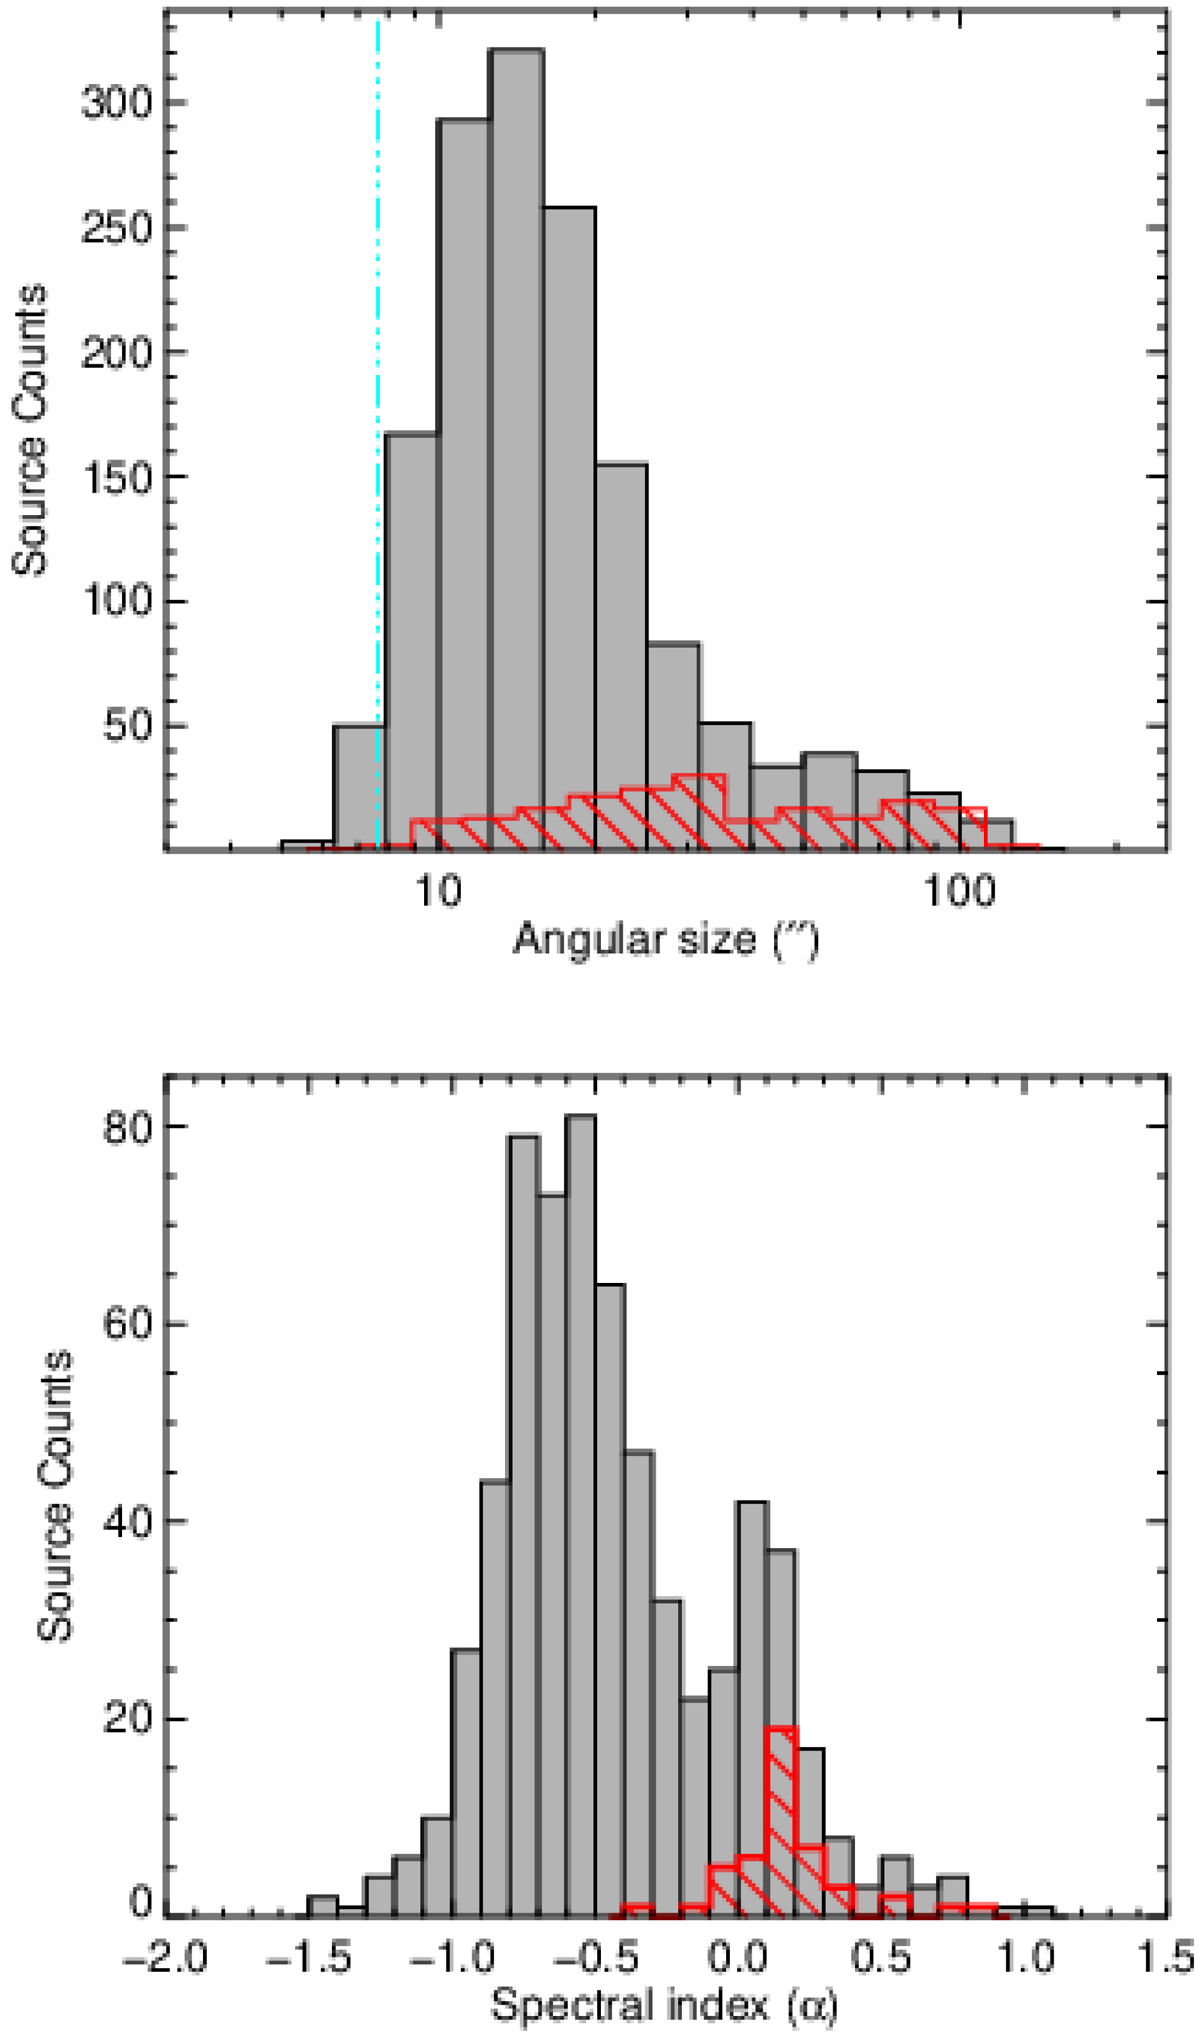
Distribution of H II region properties. Upper and lower panels: angular radius and spectral index for the whole GLOSTAR catalog (gray) and those classified as H II regions (red). The dashed-dotted vertical line drawn on the upper panel shows the radius of the beam. The bin sizes used in the upper and lower panels are 0.1 dex and 0.1, respectively.
Current usage metrics show cumulative count of Article Views (full-text article views including HTML views, PDF and ePub downloads, according to the available data) and Abstracts Views on Vision4Press platform.
Data correspond to usage on the plateform after 2015. The current usage metrics is available 48-96 hours after online publication and is updated daily on week days.
Initial download of the metrics may take a while.