Fig. 2.
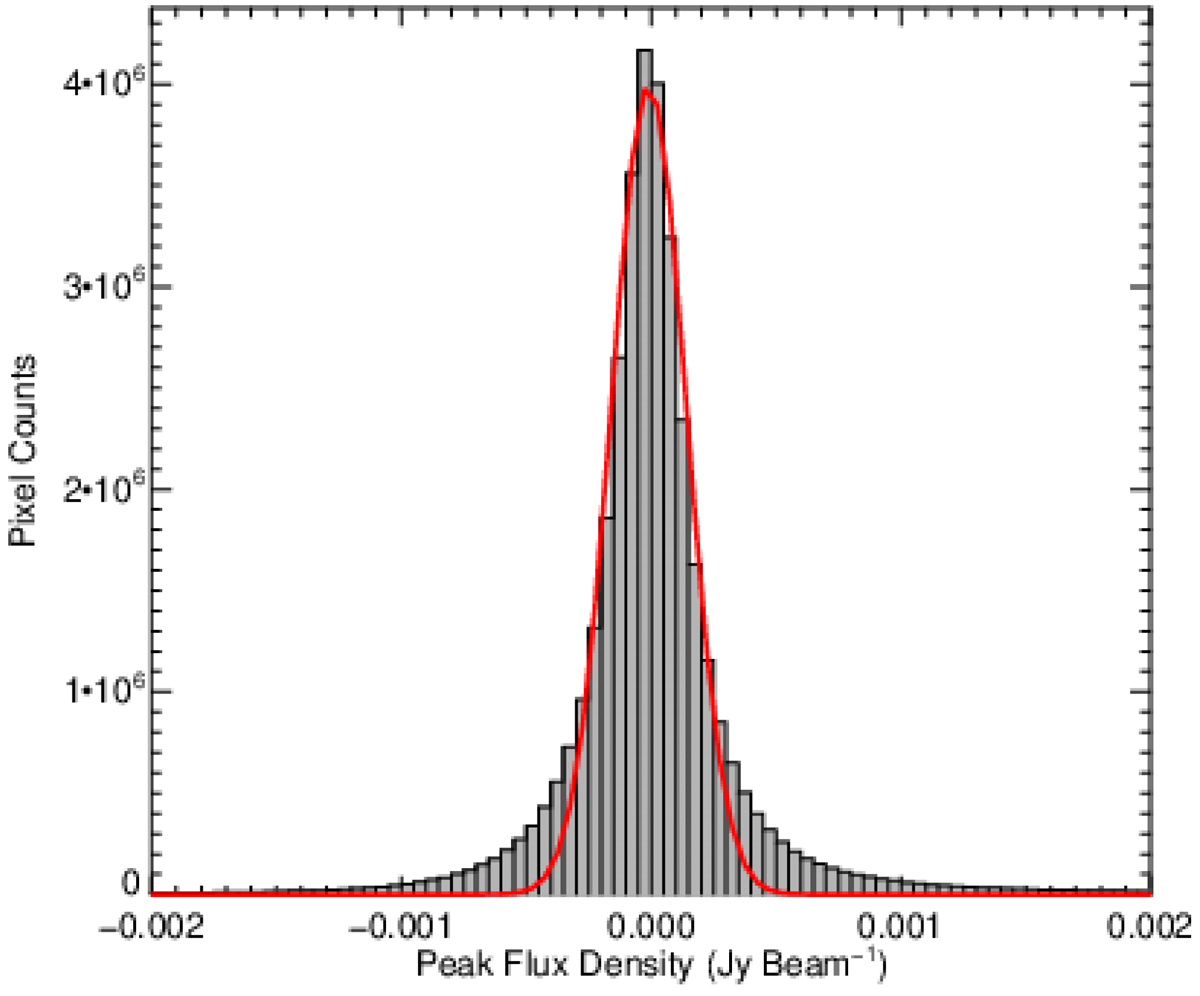
Noise distribution of the map presented in Fig. 1. We have restricted the range of pixel values to between −2 and 2 mJy in order to estimate the noise in the map and determine its sensitivity. The red line shows the results of a Gaussian fit to the distribution, which gives the standard deviation of the noise as 150 μJy. The bin size is 50 μJy.
Current usage metrics show cumulative count of Article Views (full-text article views including HTML views, PDF and ePub downloads, according to the available data) and Abstracts Views on Vision4Press platform.
Data correspond to usage on the plateform after 2015. The current usage metrics is available 48-96 hours after online publication and is updated daily on week days.
Initial download of the metrics may take a while.