Fig. 18.
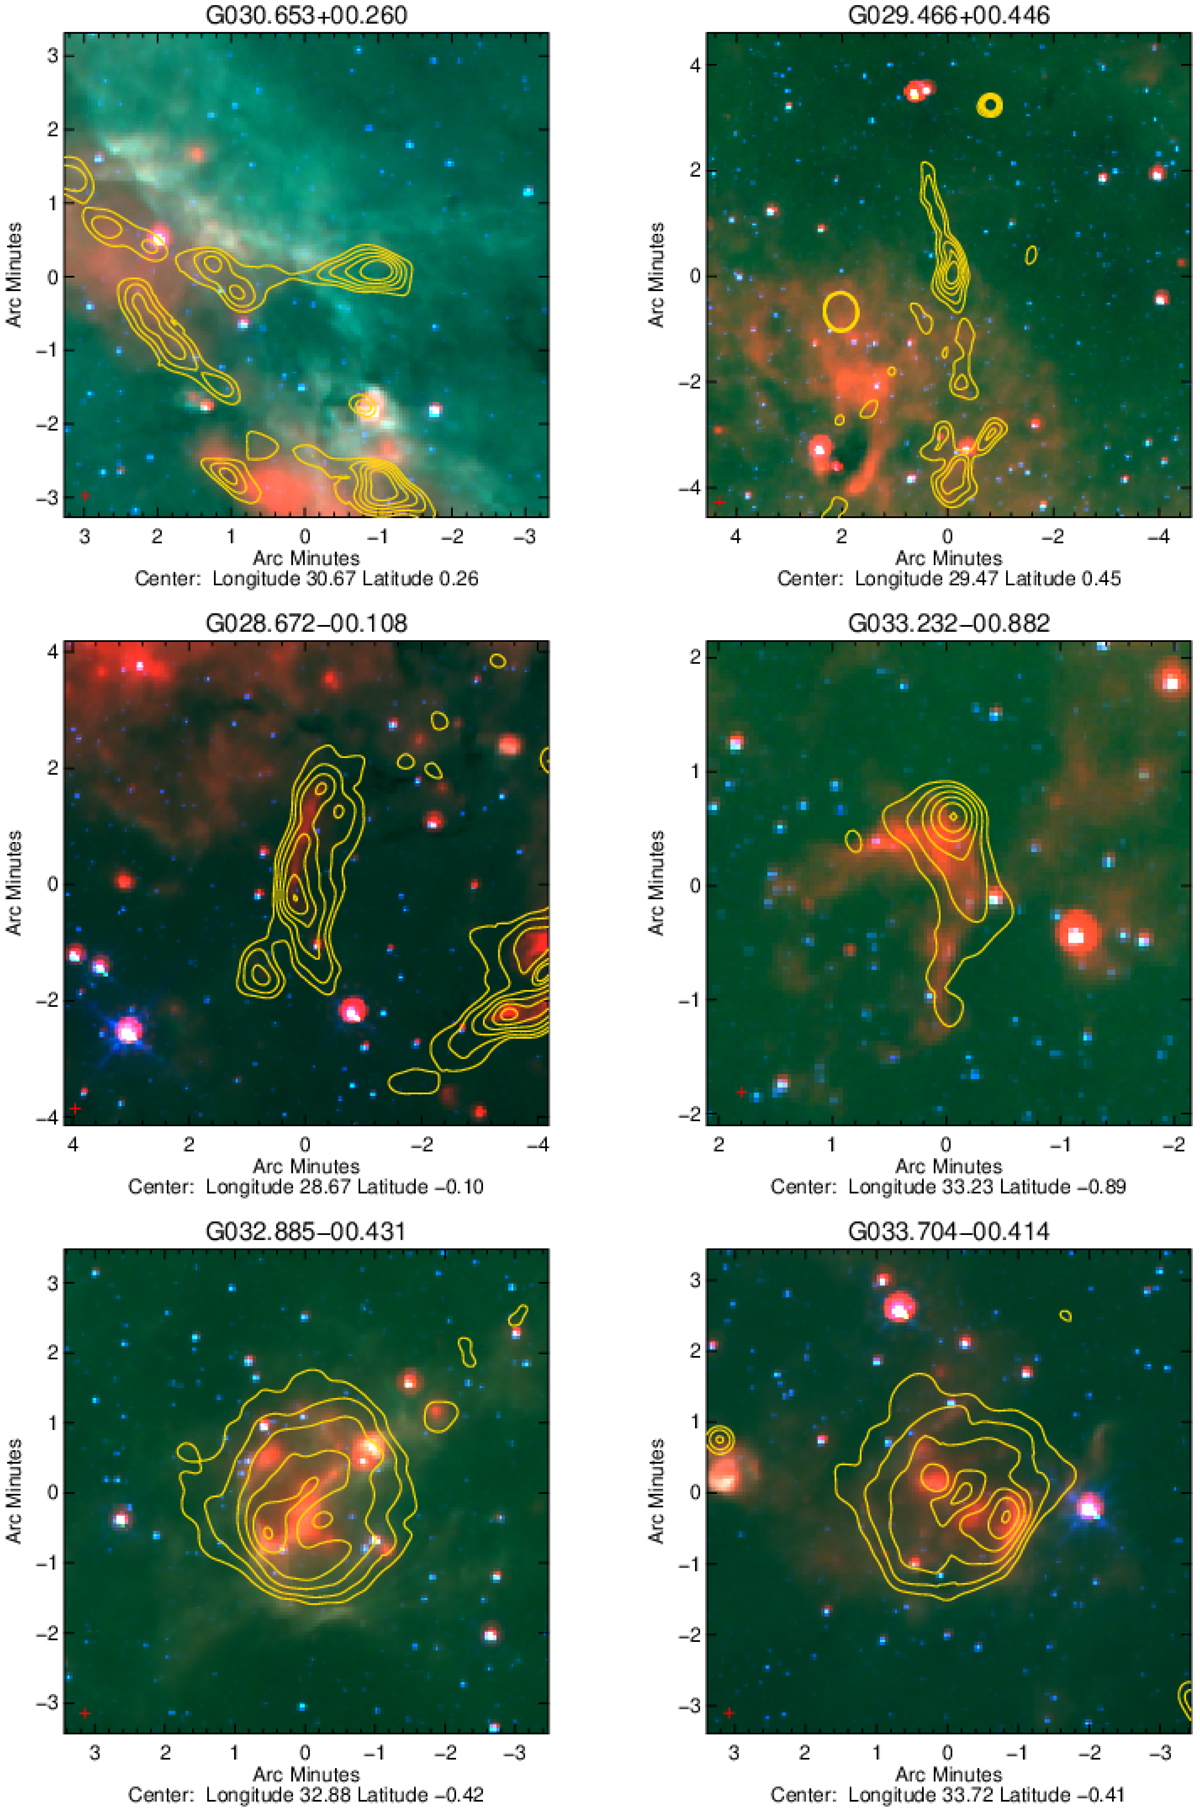
Examples of radio sources classified according to their morphology. Upper, middle, and lower panels: examples of sources classified as extended radio sources, ionization fronts, and evolved H II regions, respectively. In all cases the background image is a false color composite image produced by combining the GLIMPSE 5.8 and 8.0 μm bands and the MIPSGAL 24 μm band; these are shown in blue, green, and red, respectively. The yellow contours show the distribution of the GLOSTAR 5.8 GHz radio emission.
Current usage metrics show cumulative count of Article Views (full-text article views including HTML views, PDF and ePub downloads, according to the available data) and Abstracts Views on Vision4Press platform.
Data correspond to usage on the plateform after 2015. The current usage metrics is available 48-96 hours after online publication and is updated daily on week days.
Initial download of the metrics may take a while.