Fig. 16.
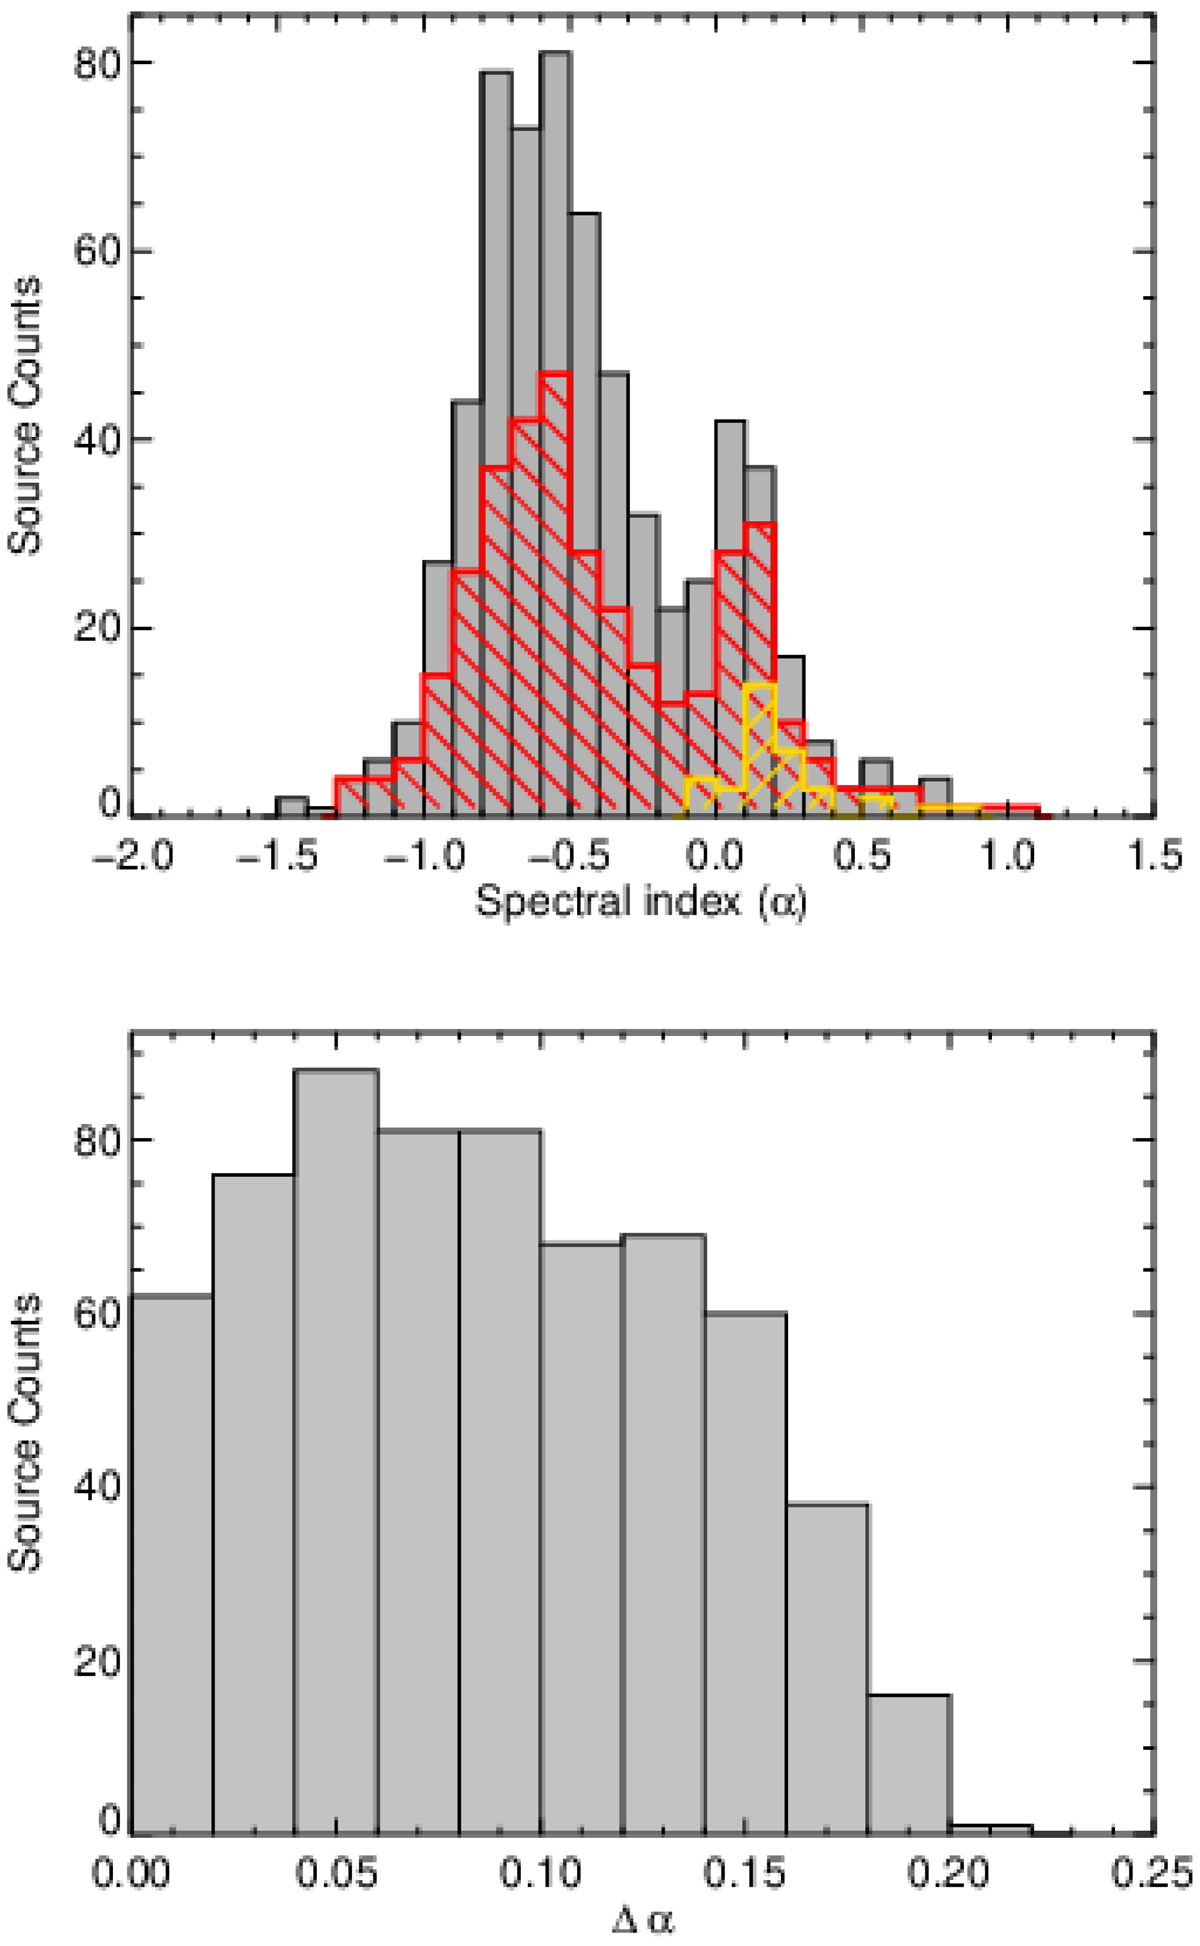
Histograms of the spectral index distribution. Upper panel: spectral index distribution of all compact GLOSTAR sources with Y-factor < 2 and a counterpart detected at 1.5 GHz in the THOR survey. The red and yellow hatched histograms show the distribution of compact radio sources that are associated with mid-infrared sources and dust emission, respectively. Lower panel: distribution of the associated uncertainties to the spectral index measurements. The bin sizes used in the upper and lower panels are 0.1 and 0.02, respectively.
Current usage metrics show cumulative count of Article Views (full-text article views including HTML views, PDF and ePub downloads, according to the available data) and Abstracts Views on Vision4Press platform.
Data correspond to usage on the plateform after 2015. The current usage metrics is available 48-96 hours after online publication and is updated daily on week days.
Initial download of the metrics may take a while.