Open Access
Fig. 15.
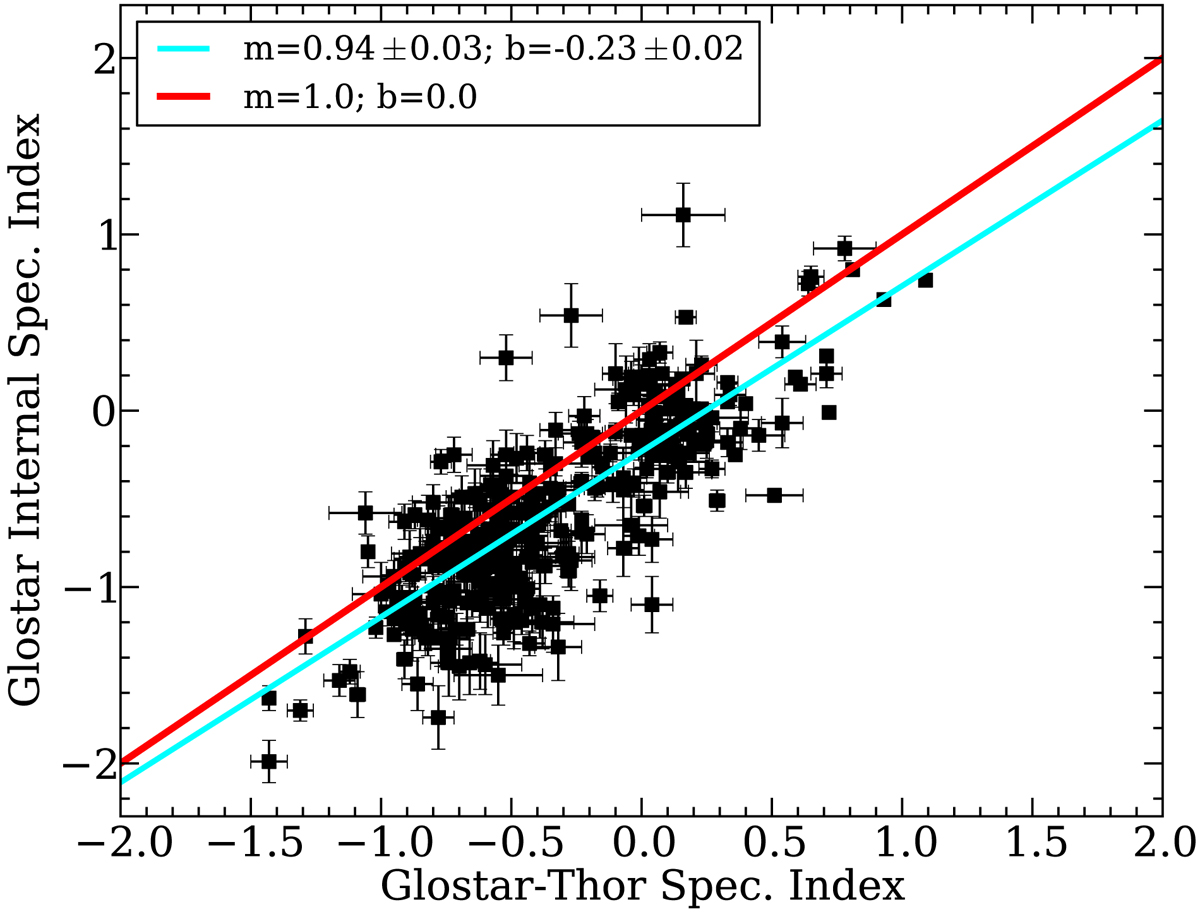
Comparison of spectral index values between only GLOSTAR data with uncertainties less than 0.2, and GLOSTAR combined with THOR data. The m and b are the slope and intersection of the linear fit, respectively, and are represented with the blue line. The red line is the line of equality.
Current usage metrics show cumulative count of Article Views (full-text article views including HTML views, PDF and ePub downloads, according to the available data) and Abstracts Views on Vision4Press platform.
Data correspond to usage on the plateform after 2015. The current usage metrics is available 48-96 hours after online publication and is updated daily on week days.
Initial download of the metrics may take a while.