Fig. 11.
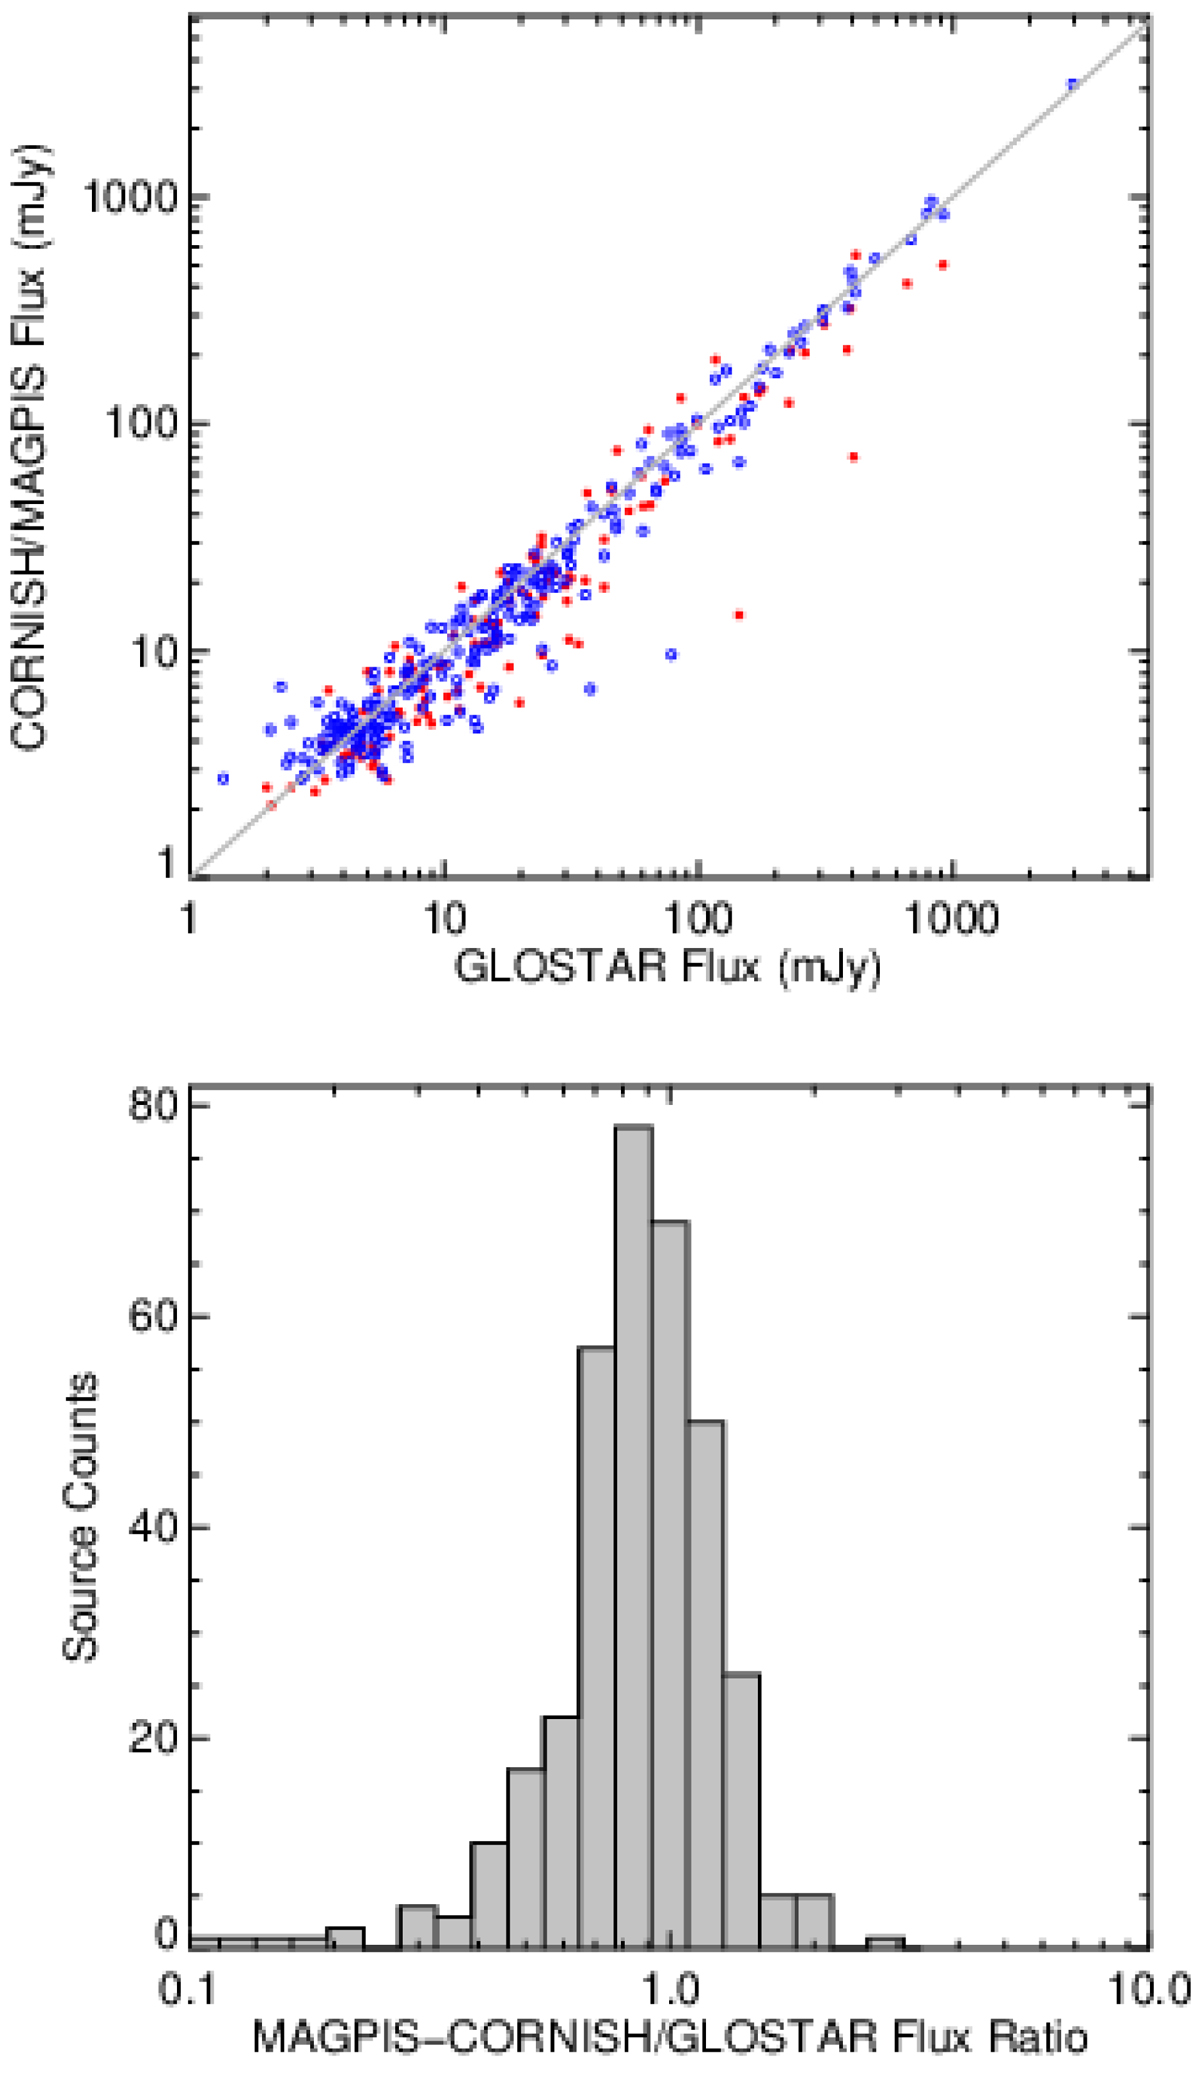
Comparison of GLOSTAR fluxes with other 5 GHz surveys. Upper panel: comparison of the GLOSTAR flux measurements with the Becker et al. (1994) survey (MAGPIS) and CORNISH; data from these are represented as red (filled) and blue (open) circles, respectively. Due to the difference in resolution between the surveys, we compare the integrated CORNISH flux densities with the peak GLOSTAR flux densities, while for the Becker et al. (1994) survey we compare the integrated flux densities with the peak GLOSTAR flux densities, when the Becker et al. (1994) source size is less than 20″ and the integrated flux from both surveys if the source is larger than 20″. The gray line is the line of equality. Lower panel: flux ratio distribution (as described above), which has a mean of 0.9 and standard deviation of 0.34.
Current usage metrics show cumulative count of Article Views (full-text article views including HTML views, PDF and ePub downloads, according to the available data) and Abstracts Views on Vision4Press platform.
Data correspond to usage on the plateform after 2015. The current usage metrics is available 48-96 hours after online publication and is updated daily on week days.
Initial download of the metrics may take a while.