Fig. 1.
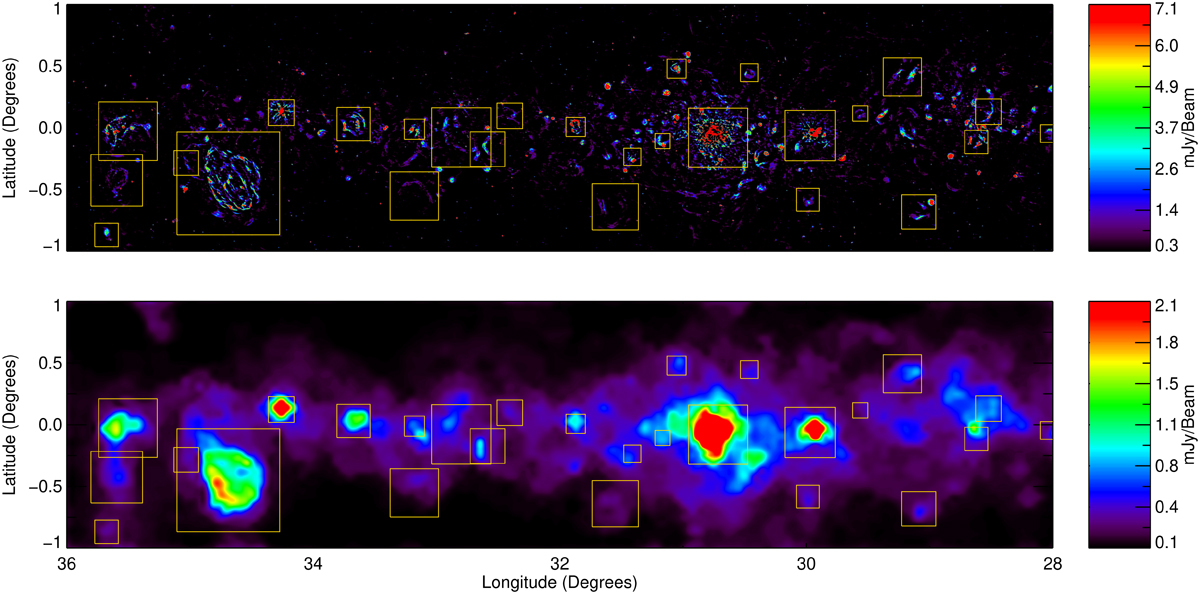
GLOSTAR mosaics and noise map of the present catalog. Upper panel: GLOSTAR radio continuum map at 5.8 GHz of 16 sq degrees of the Galactic plane (28° < ℓ < 36° and |b| < 1°). Lower panel: full resolution noise background map determined by SExtractor using a mesh size of 80 × 80 pixels and threshold of 5σ. The yellow boxes correspond to the complexes that have been identified (see Sect. 3.2.3 and Table 2 for more detailed and positions, respectively).
Current usage metrics show cumulative count of Article Views (full-text article views including HTML views, PDF and ePub downloads, according to the available data) and Abstracts Views on Vision4Press platform.
Data correspond to usage on the plateform after 2015. The current usage metrics is available 48-96 hours after online publication and is updated daily on week days.
Initial download of the metrics may take a while.