Fig. 2.
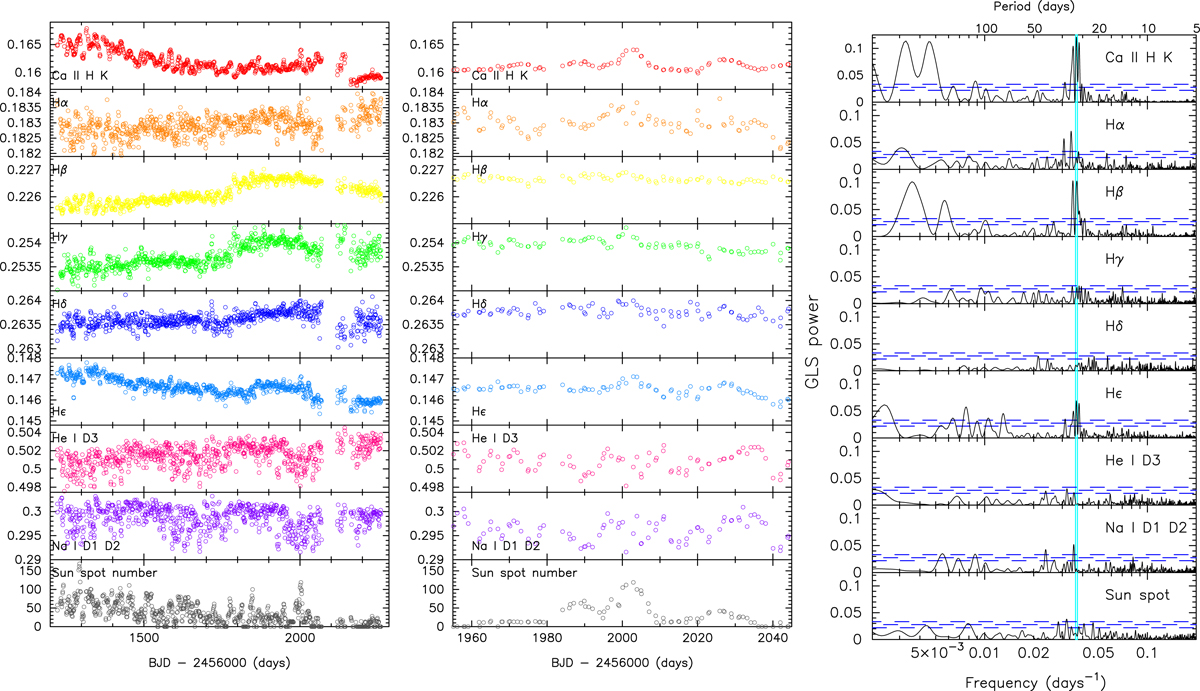
Activity indexes time series and periodograms. Left: activity indexes (defined in the text) as a function of time. Daily median values are shown. Centre: zoom on the time series covering a period of two rotations. Right: corresponding generalised Lomb-Scargle periodograms (after the subtraction of the main long-term periods, see text for details). The light blue lines indicate the solar synodic period of 27.2753 days (Allen 1977) while values corresponding to a FAP of 10%, 1%, and 0.1% are shown with dashed lines.
Current usage metrics show cumulative count of Article Views (full-text article views including HTML views, PDF and ePub downloads, according to the available data) and Abstracts Views on Vision4Press platform.
Data correspond to usage on the plateform after 2015. The current usage metrics is available 48-96 hours after online publication and is updated daily on week days.
Initial download of the metrics may take a while.