Fig. 7
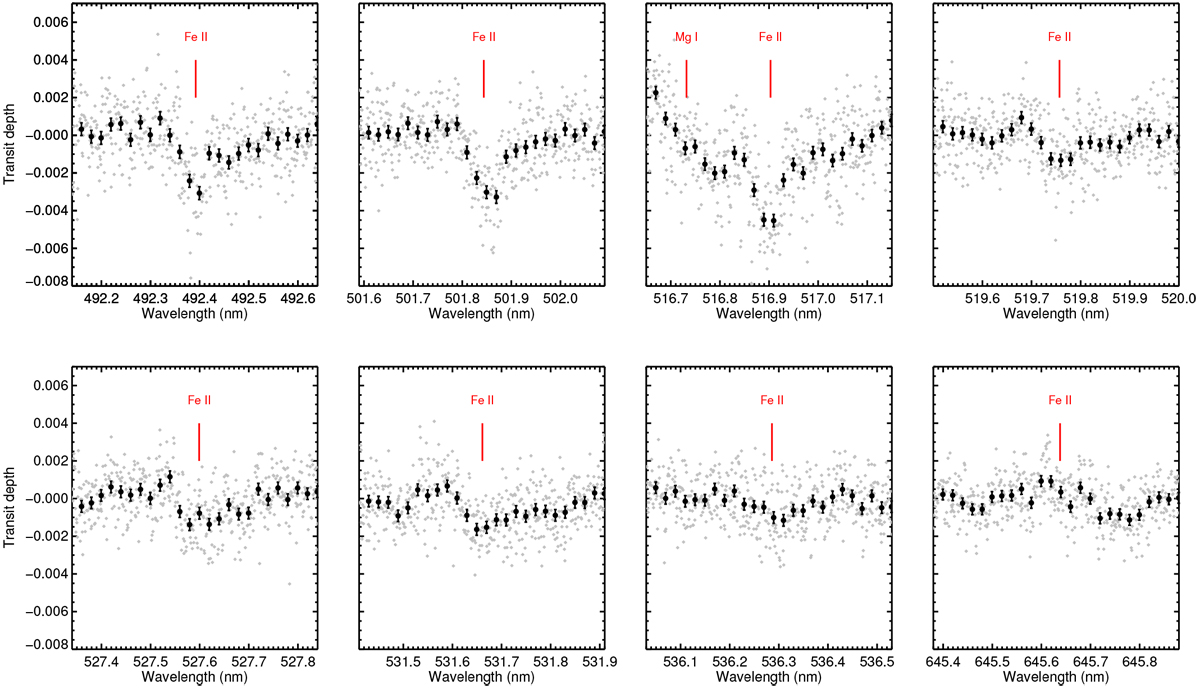
Transmission spectrum of KELT-9 b at the location of eight strong lines of Fe II that were observed by Cauley et al. (2019). The grey points show the transmission spectrum at the native sampling of the HARPS-N instrument, while the black points are binned by 20 points. The transmission spectrum is obtained following the procedure of Wyttenbach et al. (2015), and combining all in-transit exposures of the two nights. The Doppler-shadow is removed by fitting the model described in Sect. 2 at the expected locations of the individual lines. The presence of these lines appears to be confirmed by our HARPS-N observations, but non-Gaussian systematic noise occurs at the ~ 10−3 level. This hinders the identification of all but the strongest Fe II lines.
Current usage metrics show cumulative count of Article Views (full-text article views including HTML views, PDF and ePub downloads, according to the available data) and Abstracts Views on Vision4Press platform.
Data correspond to usage on the plateform after 2015. The current usage metrics is available 48-96 hours after online publication and is updated daily on week days.
Initial download of the metrics may take a while.