Fig. 5
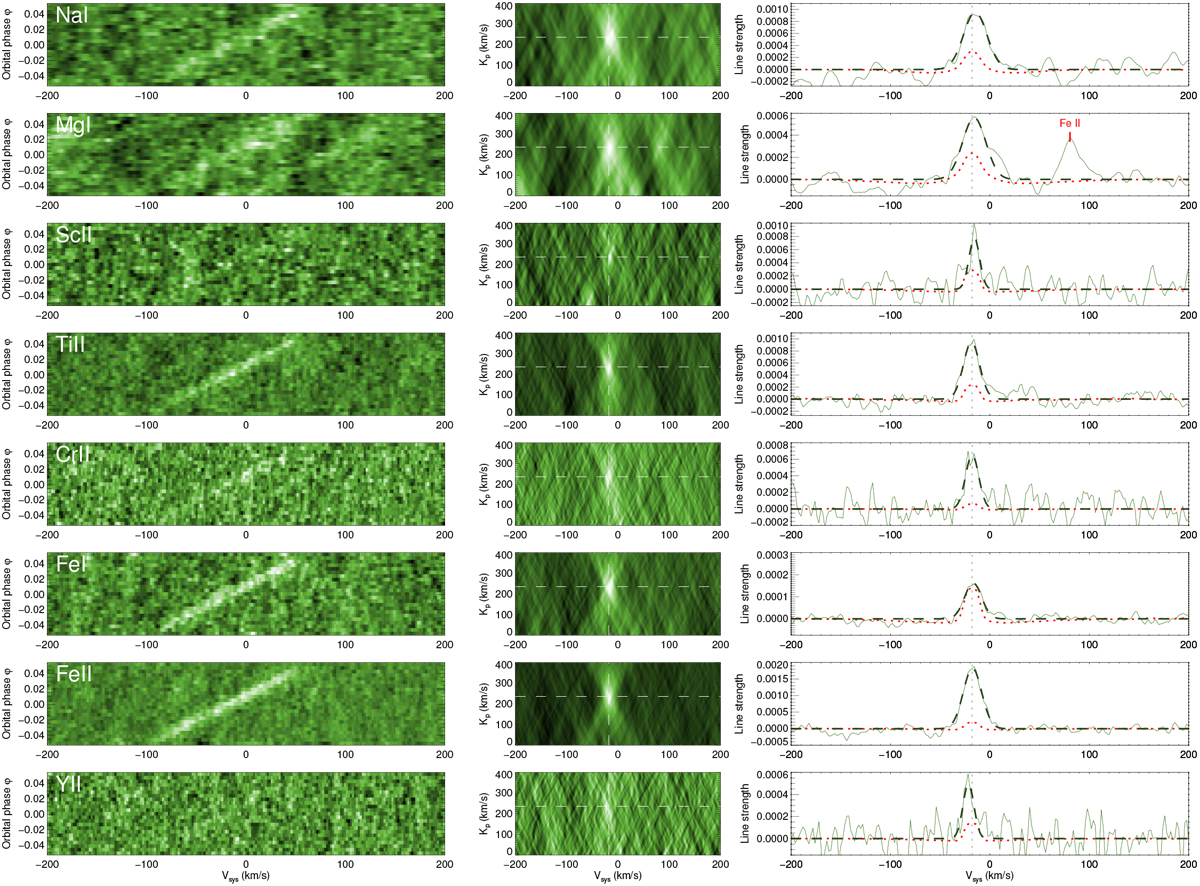
Cross-correlation signatures of Na I, Mg I, Sc II, Ti II, Cr II, Fe I, Fe II and Y II averaged over both nights of observation. Each row of panels is associated with one species. Left panel in each row: two-dimensional cross-correlation function c(v, t), in which thesignature of the transiting planet atmosphere has a slanted shape, as is most evident in the case of Fe I, Fe II and Ti II that were previously reported in Hoeijmakers et al. (2018a). Middle panel in each row: co-addition obtained by summing the in-transit exposures to the rest-frame velocity of the planet, assuming a range of orbital velocities, Kp. The white dashed lines indicate the expected systemic velocity, vsys (see Sect. 4.3) and orbital velocity (see Sect. 4.4). Right-most panel: one-dimensional cross-correlation function co-added in the rest-frame corresponding to the expected orbital velocity of the planet. The green line denotes the average cross-correlation over both observing nights. The dashed black line is a Gaussian fit to the profiles, with the resulting best-fit parameters provided in Table 2. The dotted red line is the signature of the injected model template. Apart from Fe I, all observed absorption lines appear to be significantly deeper than predicted for a 4000 K solar metallicity model in chemical equilibrium. The cross-correlation enhancement ~ 80 km s−1 redward of the Mg I line is caused by a strong Fe II line, which is also indicated in Fig. 7.
Current usage metrics show cumulative count of Article Views (full-text article views including HTML views, PDF and ePub downloads, according to the available data) and Abstracts Views on Vision4Press platform.
Data correspond to usage on the plateform after 2015. The current usage metrics is available 48-96 hours after online publication and is updated daily on week days.
Initial download of the metrics may take a while.