Free Access
Fig. C.2
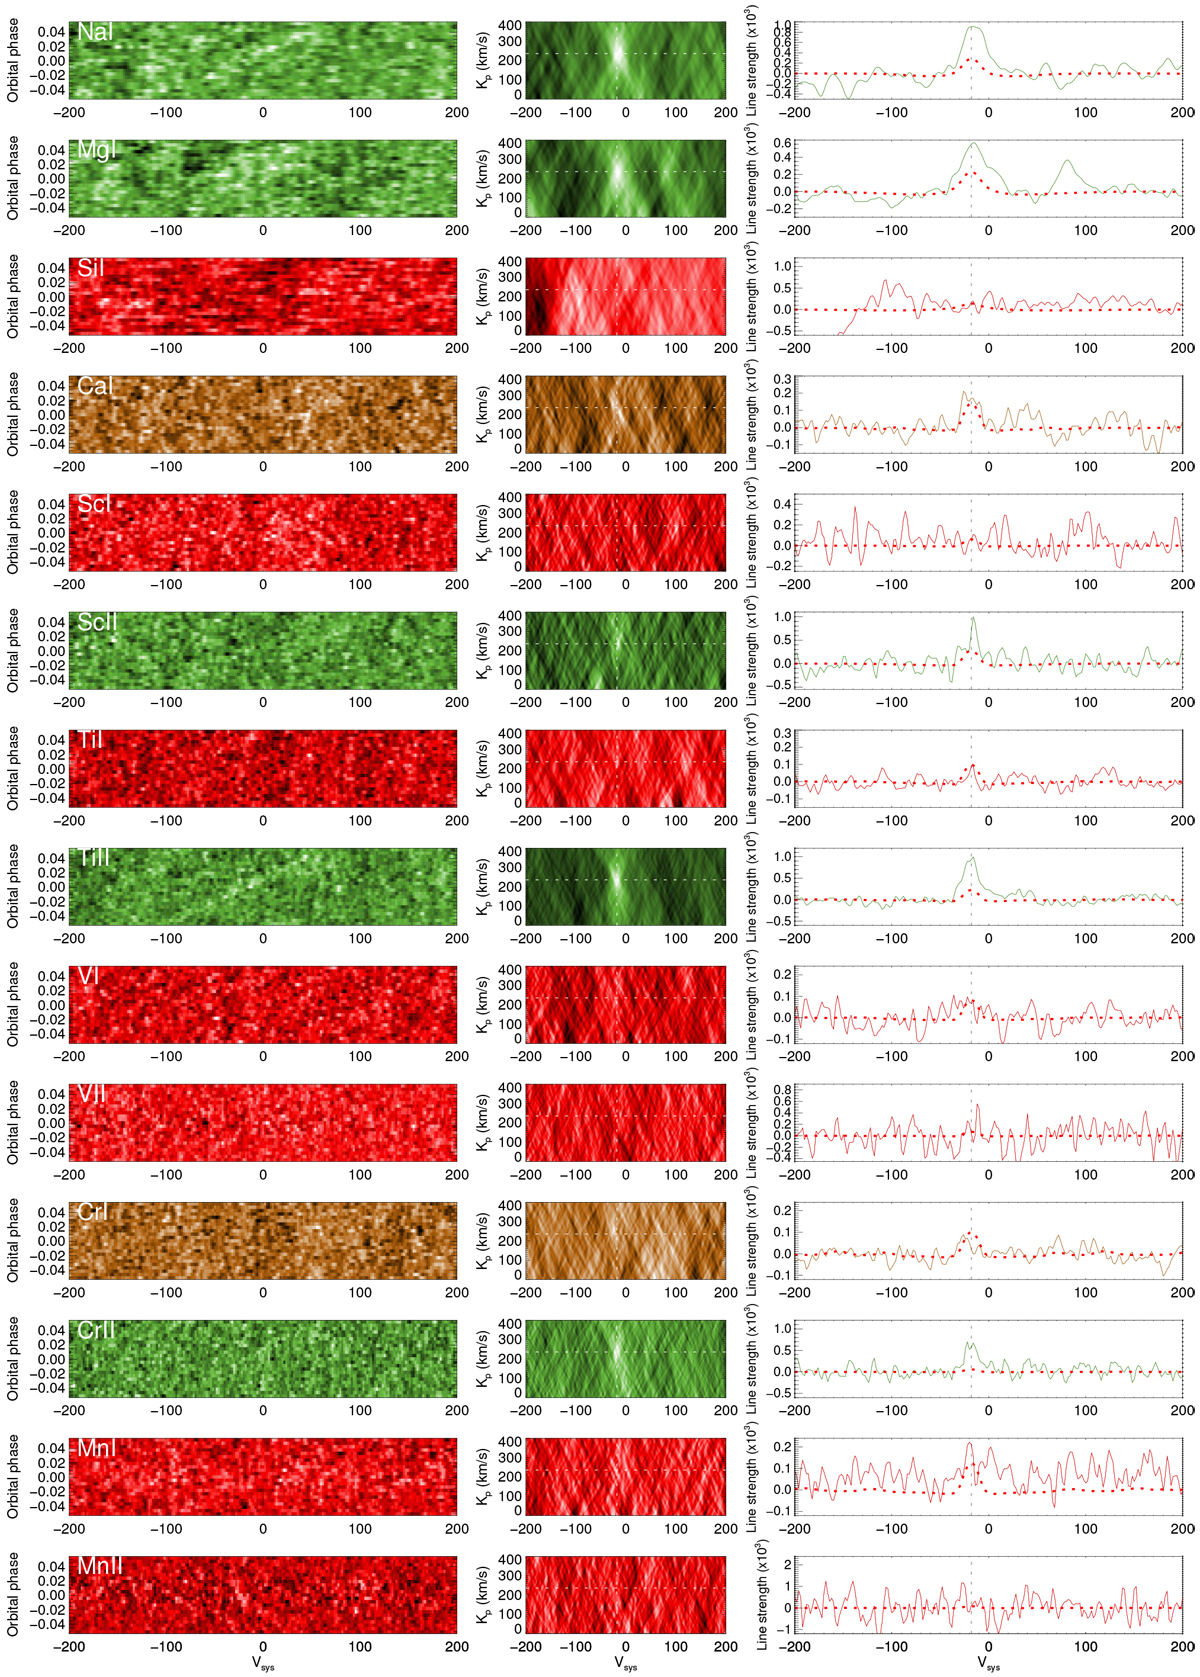
Cross-correlation functions of all surveyed species highlighted in Fig. C.1. The colours indicate detections (green) and non-detections (red), as well as tentative signatures that occur at the expected radial and orbital velocities of the planet, but at low confidence and/or with an irregular structure (brown).
Current usage metrics show cumulative count of Article Views (full-text article views including HTML views, PDF and ePub downloads, according to the available data) and Abstracts Views on Vision4Press platform.
Data correspond to usage on the plateform after 2015. The current usage metrics is available 48-96 hours after online publication and is updated daily on week days.
Initial download of the metrics may take a while.