Fig. C.1
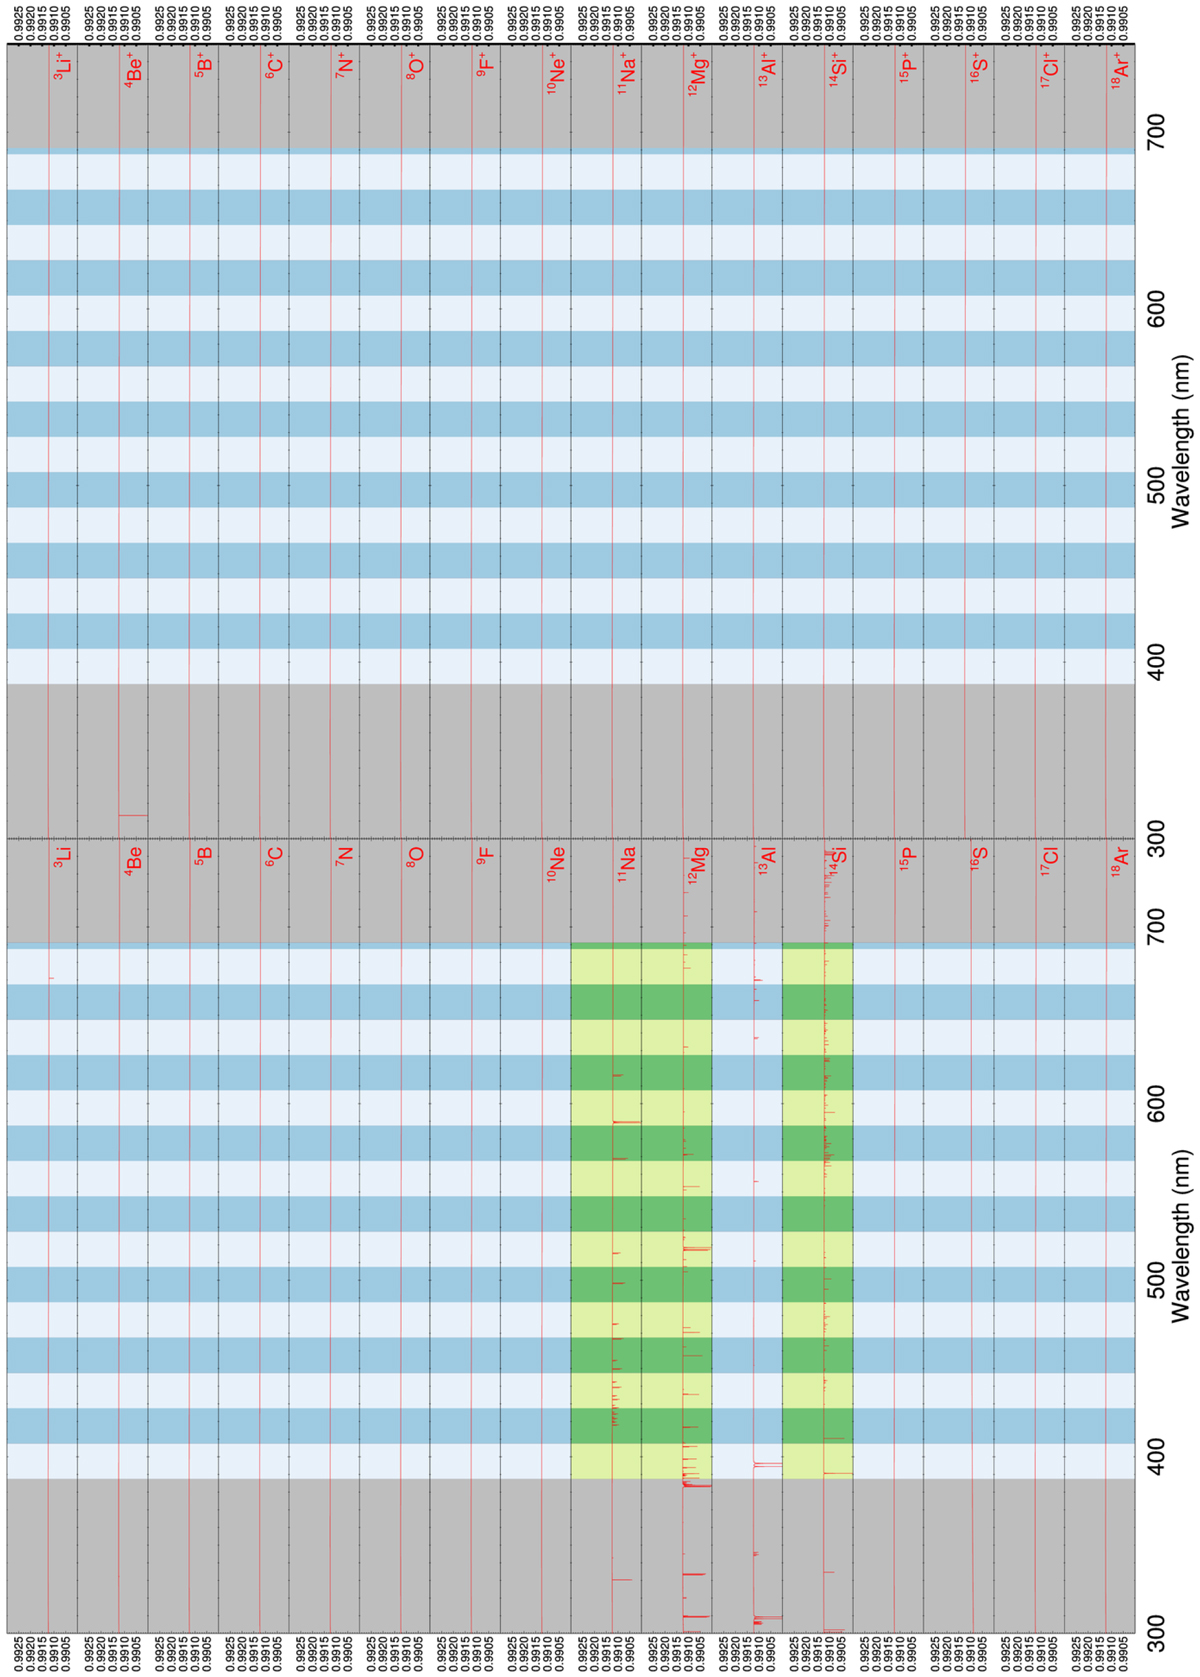
Modelled spectra of all neutral and singly ionized species in our survey, with the atomic number increasing downwards. The spectra are computed at solar metallicity and a temperature of 4000 K, with a continuum set by H−. The y-axis denotes transit depth, with unity equal to the out-of-transit flux of the star. The shaded grey areas demarcate the edges of the HARPS-N waveband. The alternating shaded colours indicate the 20 nm wide bands for which the cross-correlation analysis is performed independently. Green and lime highlighted species are species with significant expected line opacity and that were selected for cross-correlation. Species for which no spectrum is plotted were lacking in line-list data.
Current usage metrics show cumulative count of Article Views (full-text article views including HTML views, PDF and ePub downloads, according to the available data) and Abstracts Views on Vision4Press platform.
Data correspond to usage on the plateform after 2015. The current usage metrics is available 48-96 hours after online publication and is updated daily on week days.
Initial download of the metrics may take a while.