Fig. 1
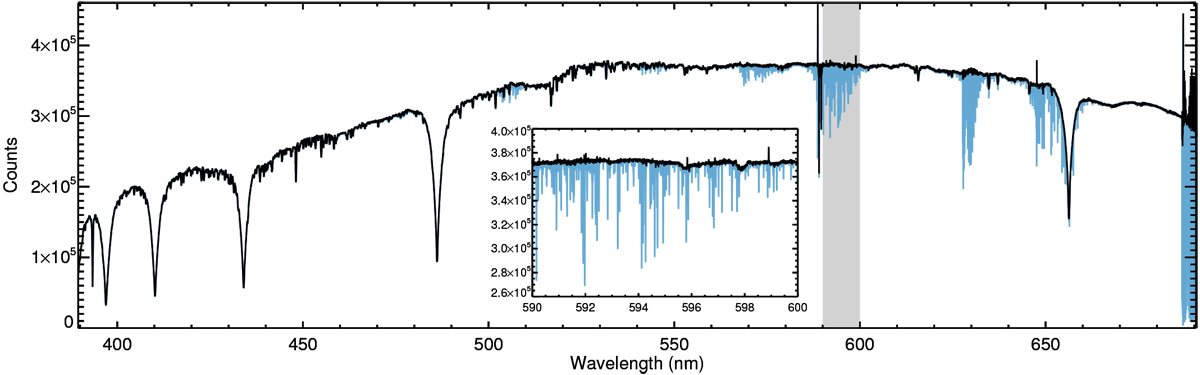
Mean out-of-transit spectrum of the KELT-9 system as observed by HARPS-N, produced by stitching together the individual spectral orders after correction of the blaze function. The blue and black lines show the spectrum before and after telluric correction. The smaller panel shows the telluric water band that is highlighted in grey in detail, demonstrating the effect of the telluric correction. The outlying points are residuals of deep telluric absorption and a small number of emission lines that have remained uncorrected.
Current usage metrics show cumulative count of Article Views (full-text article views including HTML views, PDF and ePub downloads, according to the available data) and Abstracts Views on Vision4Press platform.
Data correspond to usage on the plateform after 2015. The current usage metrics is available 48-96 hours after online publication and is updated daily on week days.
Initial download of the metrics may take a while.