Fig. 7.
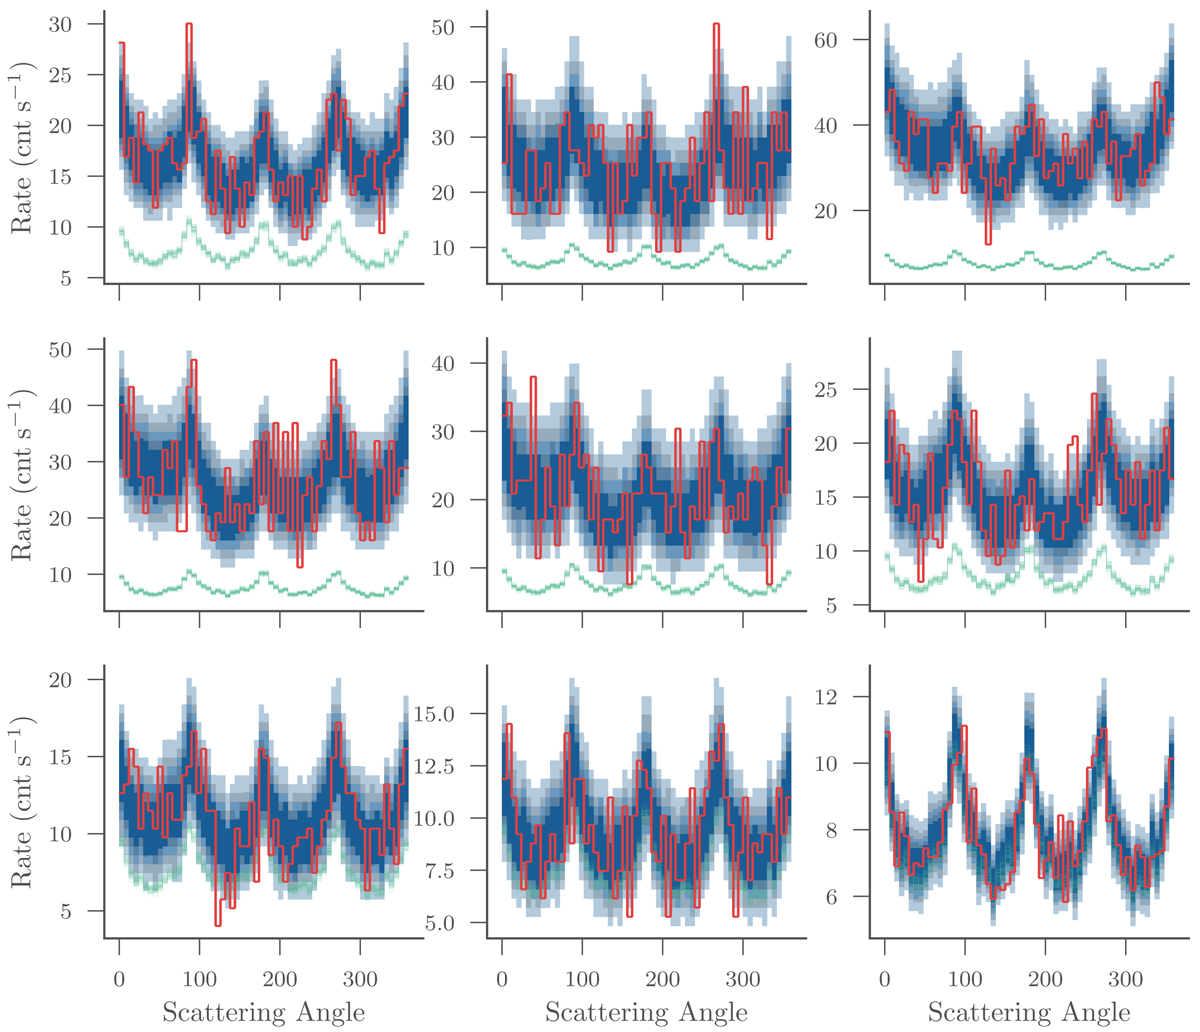
Posterior predictive checks for the total polarization count rate data. The dark to light blue shaded regions indicate the 50th, 60th, 70th, 80th, and 90th percentiles of the replicated data respectively of the replicated data. The observed data are displayed in red. The estimated background count rates are displayed in green.
Current usage metrics show cumulative count of Article Views (full-text article views including HTML views, PDF and ePub downloads, according to the available data) and Abstracts Views on Vision4Press platform.
Data correspond to usage on the plateform after 2015. The current usage metrics is available 48-96 hours after online publication and is updated daily on week days.
Initial download of the metrics may take a while.