Open Access
Fig. 6.
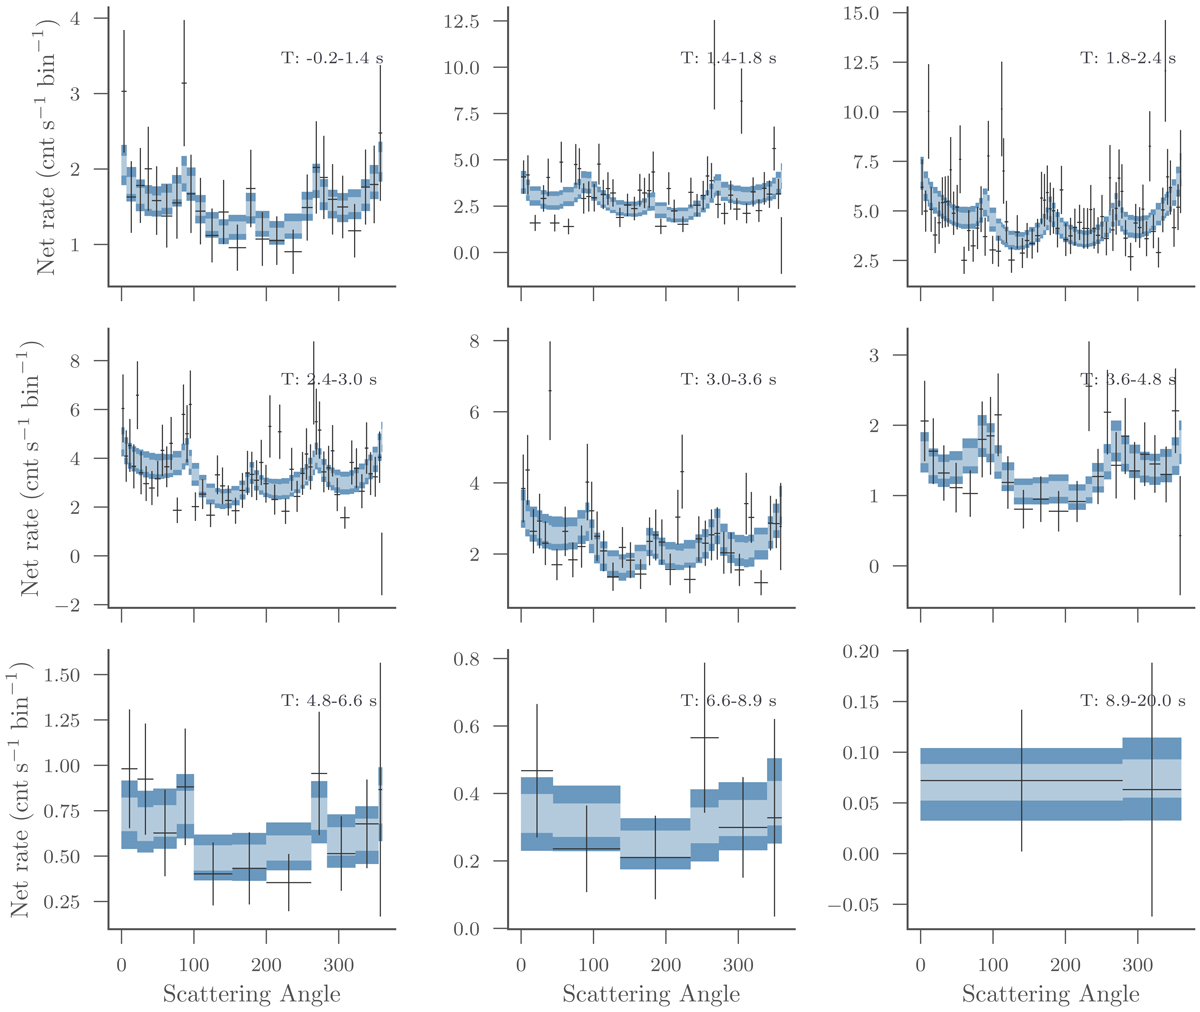
Net SA data for each fitted time interval in our analysis. Superimposed are the posterior model predictions from the fits. The data have been rebinned for visual clarity. The SA presented here is measured within an arbitrary local coordinate system of POLAR.
Current usage metrics show cumulative count of Article Views (full-text article views including HTML views, PDF and ePub downloads, according to the available data) and Abstracts Views on Vision4Press platform.
Data correspond to usage on the plateform after 2015. The current usage metrics is available 48-96 hours after online publication and is updated daily on week days.
Initial download of the metrics may take a while.