Fig. 5.
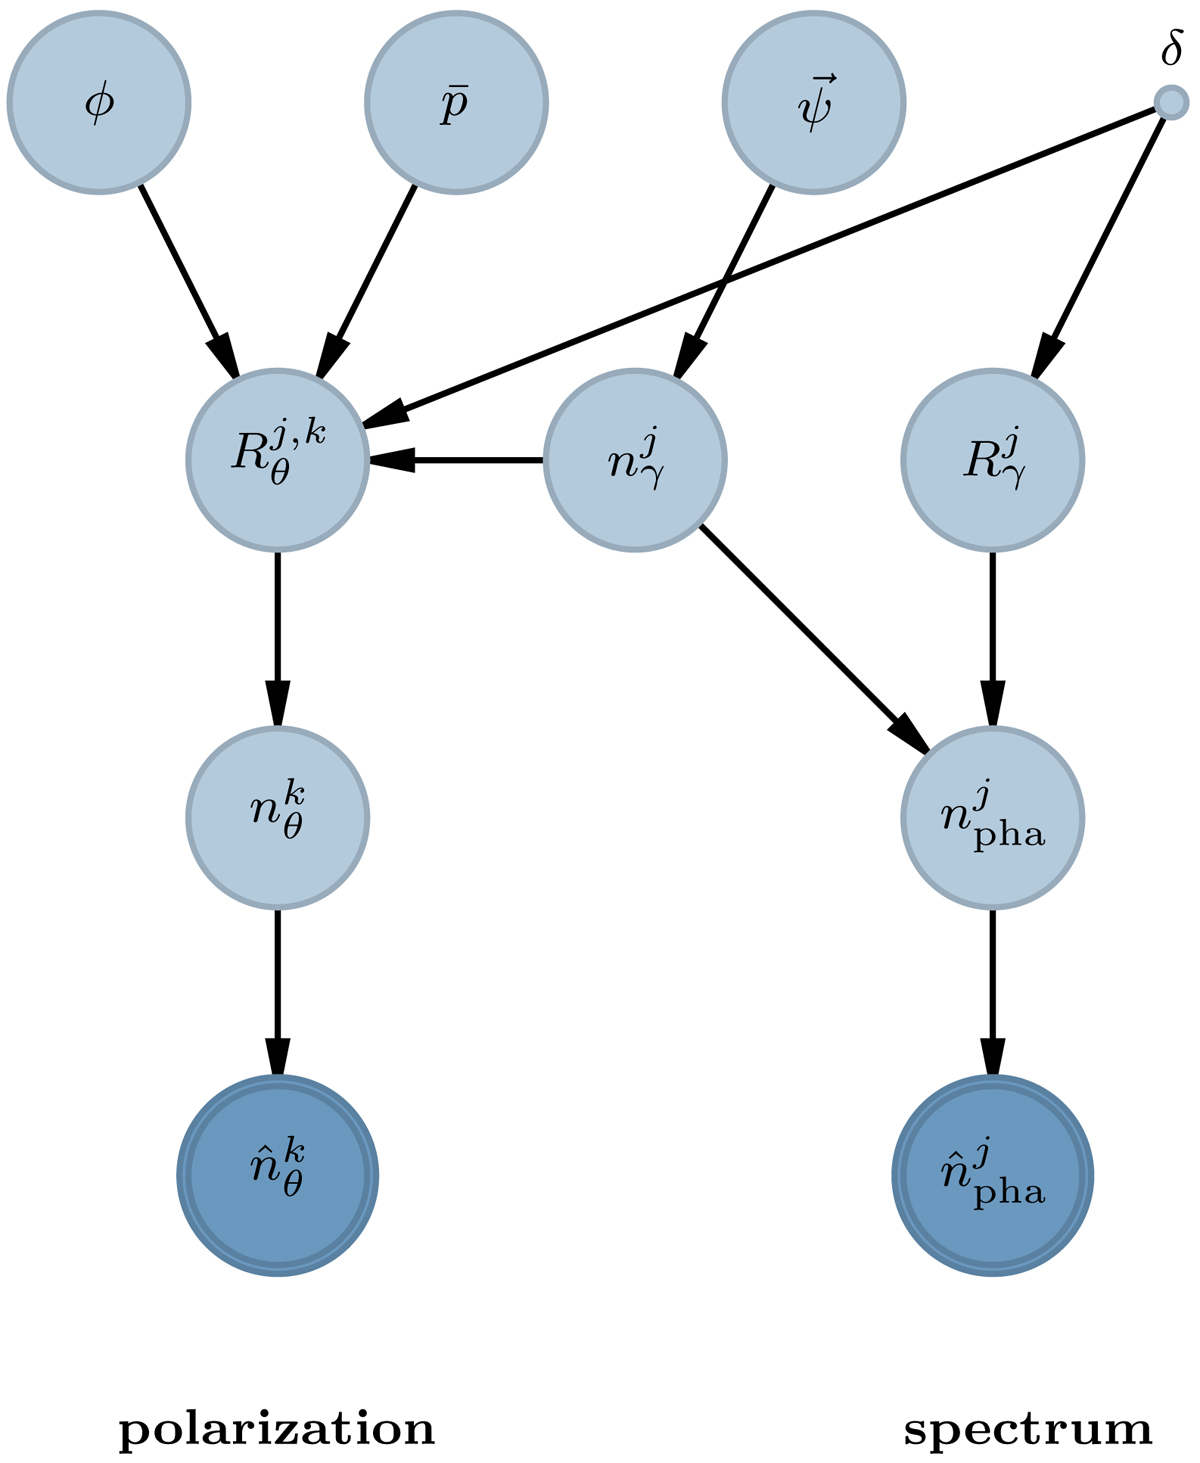
Directed graph model describing the full likelihood of our approach. Model parameters are shown in light blue, and the data in dark blue. The graph shows how the latent parameters of the model are connected to each other and eventually the data. It is important to note that the latent photon model connects both sides of the model. The position (δ) is a fixed parameter. Here ψ represents the set of spectral parameters.
Current usage metrics show cumulative count of Article Views (full-text article views including HTML views, PDF and ePub downloads, according to the available data) and Abstracts Views on Vision4Press platform.
Data correspond to usage on the plateform after 2015. The current usage metrics is available 48-96 hours after online publication and is updated daily on week days.
Initial download of the metrics may take a while.