Fig. 4.
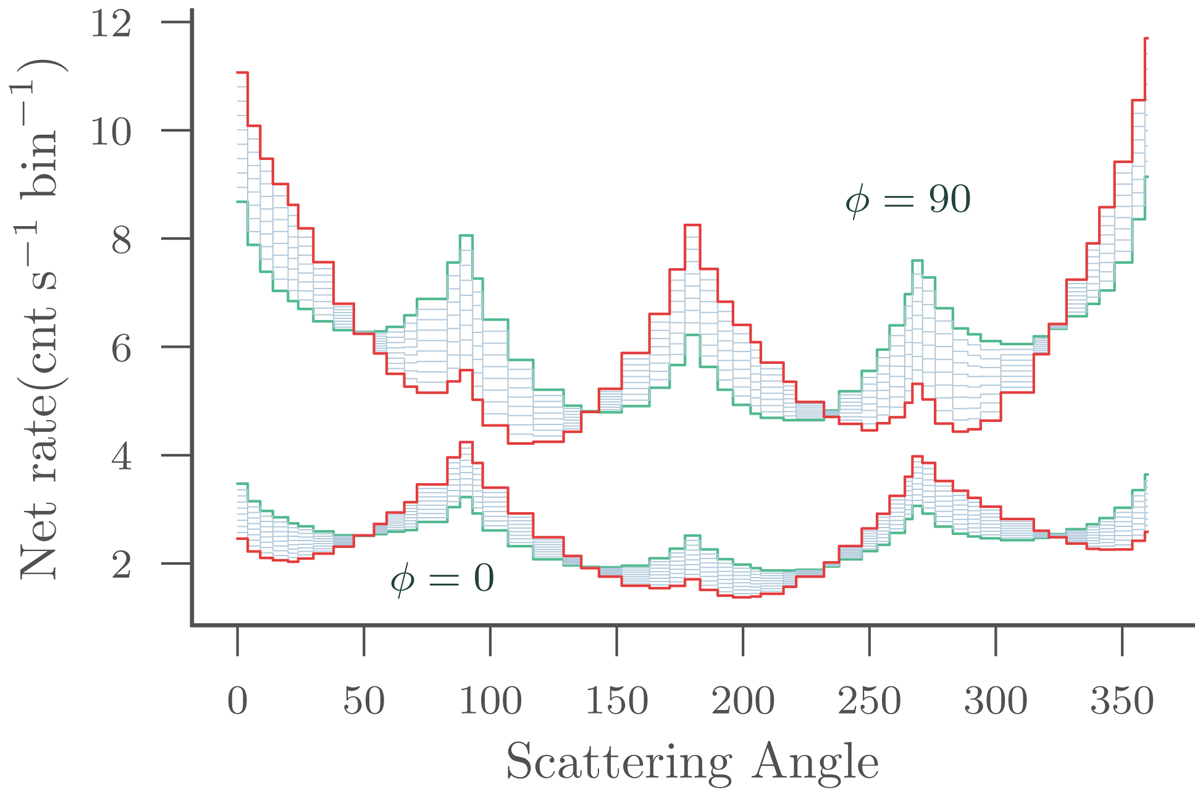
Folded POLAR count space for two polarization angles and ten levels of polarization degree. The rates have been artificially scaled to between the different angles for visual clarity. The green lines for both angles represent the polarization degree ![]() and the red lines
and the red lines ![]() . Thus, we can see how various sets of polarization parameters can be identified in the data. The peaks with a 90° periodicity are the result of POLAR’s square shape, while the visible modulation with a 360° period is a result of the incoming direction of the photons with respect to the instrument’s zenith. By forward-modeling the instrument response, the systematics induced by geometrical effects are properly accounted for.
. Thus, we can see how various sets of polarization parameters can be identified in the data. The peaks with a 90° periodicity are the result of POLAR’s square shape, while the visible modulation with a 360° period is a result of the incoming direction of the photons with respect to the instrument’s zenith. By forward-modeling the instrument response, the systematics induced by geometrical effects are properly accounted for.
Current usage metrics show cumulative count of Article Views (full-text article views including HTML views, PDF and ePub downloads, according to the available data) and Abstracts Views on Vision4Press platform.
Data correspond to usage on the plateform after 2015. The current usage metrics is available 48-96 hours after online publication and is updated daily on week days.
Initial download of the metrics may take a while.