Open Access
Fig. 3.
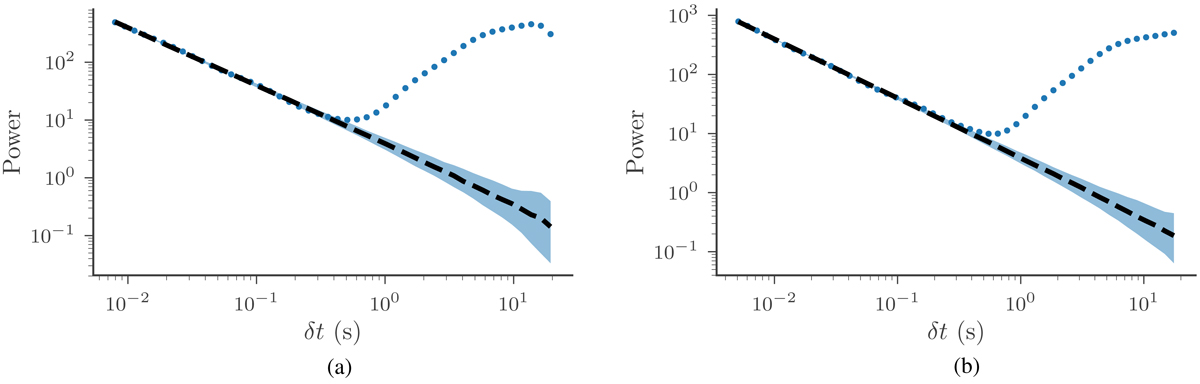
Minimum variability timescales for the polar polarization data (left) and the GBM spectral data (right). The black line indicates the background power spectrum determined via Monte Carlo calculations and the shaded regions indicates the uncertainty in the background. Notably, both data sets have nearly equivalent MVTs.
Current usage metrics show cumulative count of Article Views (full-text article views including HTML views, PDF and ePub downloads, according to the available data) and Abstracts Views on Vision4Press platform.
Data correspond to usage on the plateform after 2015. The current usage metrics is available 48-96 hours after online publication and is updated daily on week days.
Initial download of the metrics may take a while.