Open Access
Fig. 2.
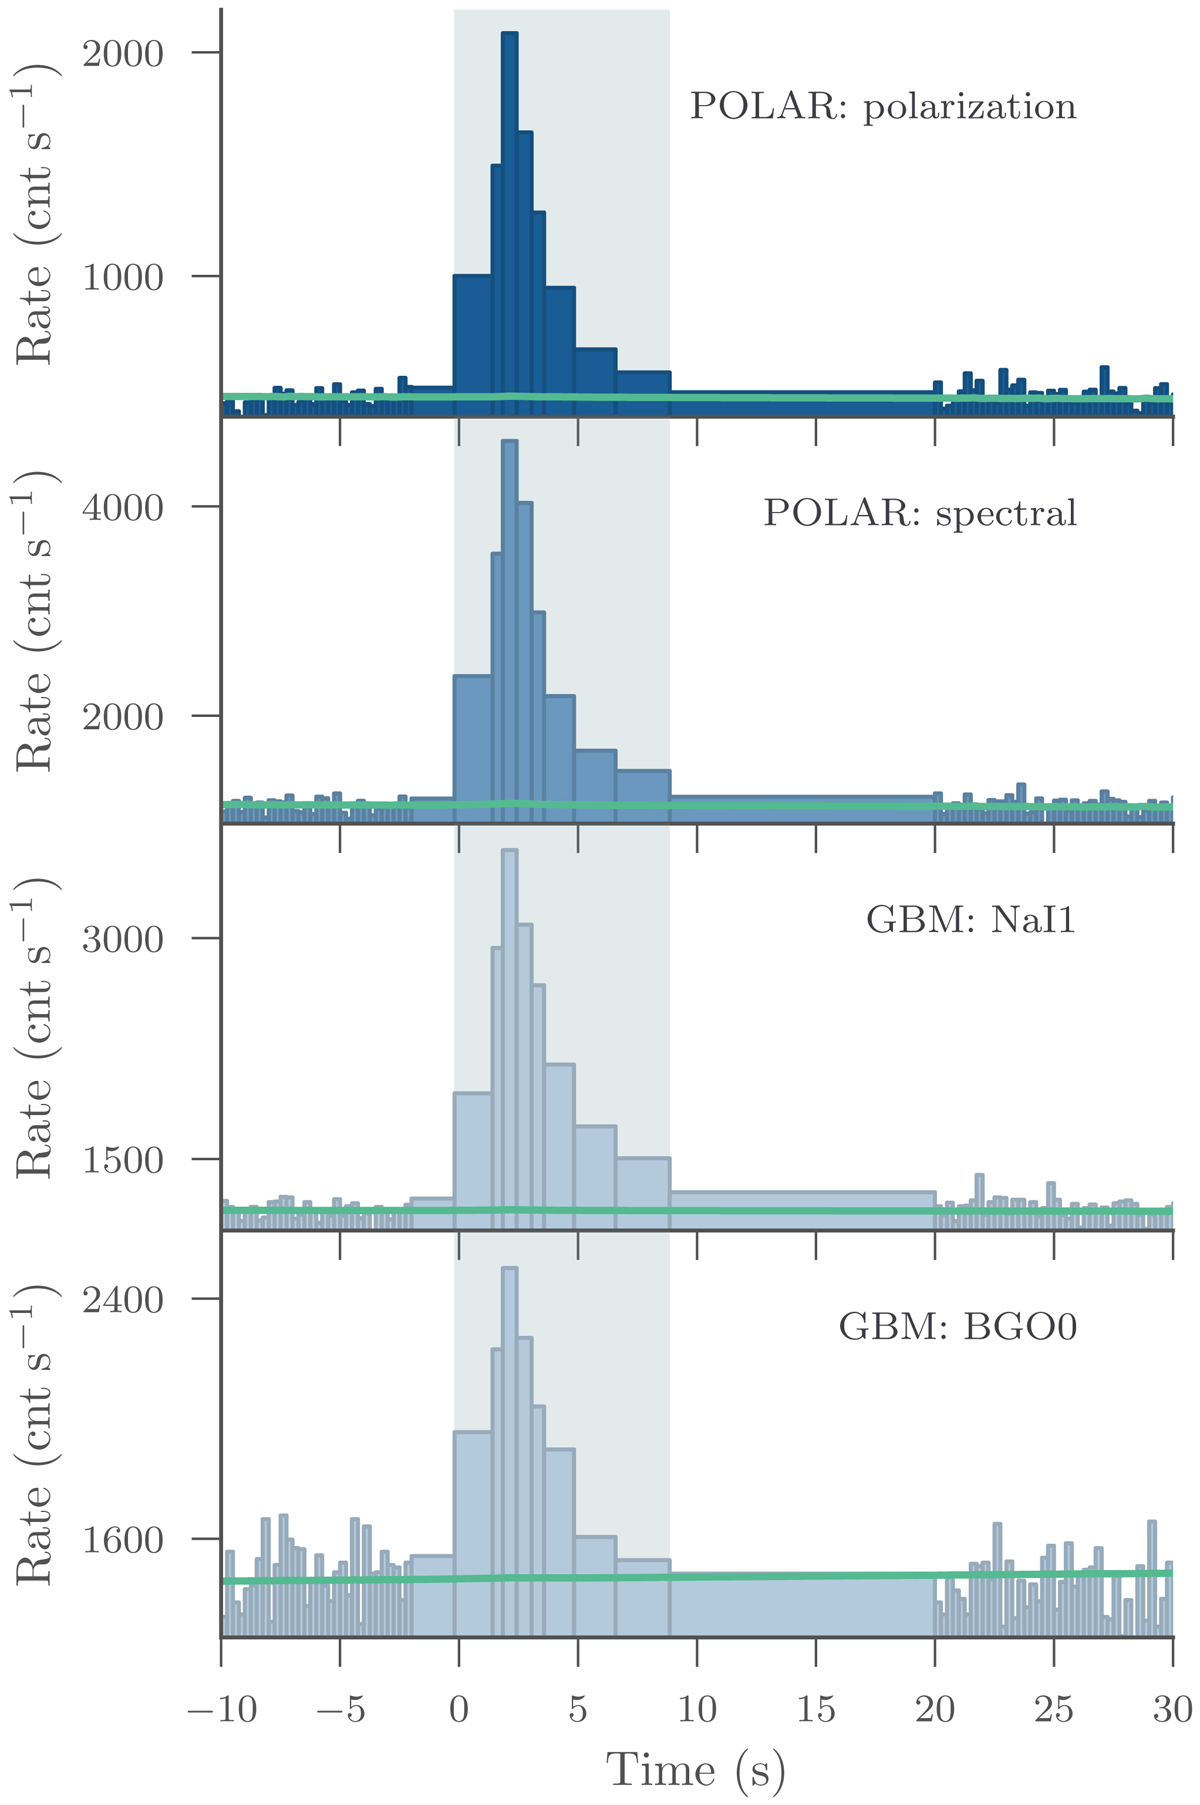
Light curves of the POLAR polarization and spectral data (the difference is explained in Appendix A) as well as two GBM detector data. The green line is the fitted background model and the gray shaded regions show the time-intervals used for the analysis. The binning in the analysis region is derived via Bayesian blocks.
Current usage metrics show cumulative count of Article Views (full-text article views including HTML views, PDF and ePub downloads, according to the available data) and Abstracts Views on Vision4Press platform.
Data correspond to usage on the plateform after 2015. The current usage metrics is available 48-96 hours after online publication and is updated daily on week days.
Initial download of the metrics may take a while.