Fig. B.1.
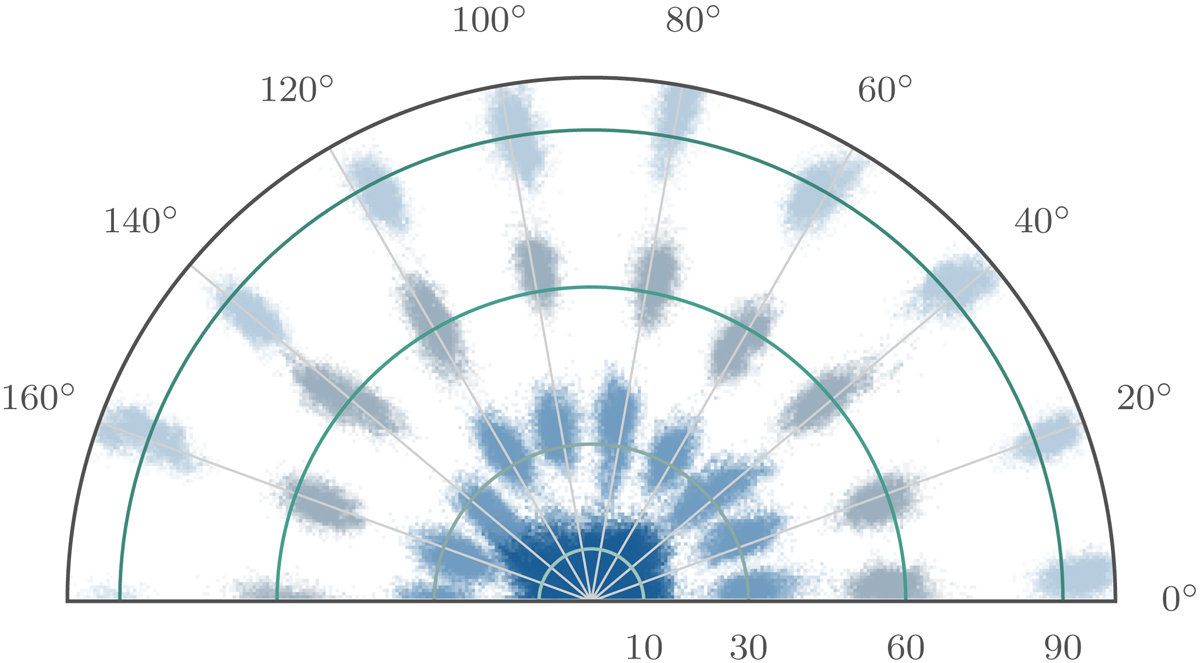
Posterior samples from fits to simulated polarization and spectral data simulated with a high signal-to-noise ratio. The true simulated polarization degrees and lines are demonstrated with green lines and gray rays respectively. The posterior samples are colored from dark blue to light blue with increasing simulated polarization degree. Thus, we demonstrate that our posteriors encapsulate the simulated values directly without resorting to the statistical approximations of past works.
Current usage metrics show cumulative count of Article Views (full-text article views including HTML views, PDF and ePub downloads, according to the available data) and Abstracts Views on Vision4Press platform.
Data correspond to usage on the plateform after 2015. The current usage metrics is available 48-96 hours after online publication and is updated daily on week days.
Initial download of the metrics may take a while.