Open Access
Fig. 1.
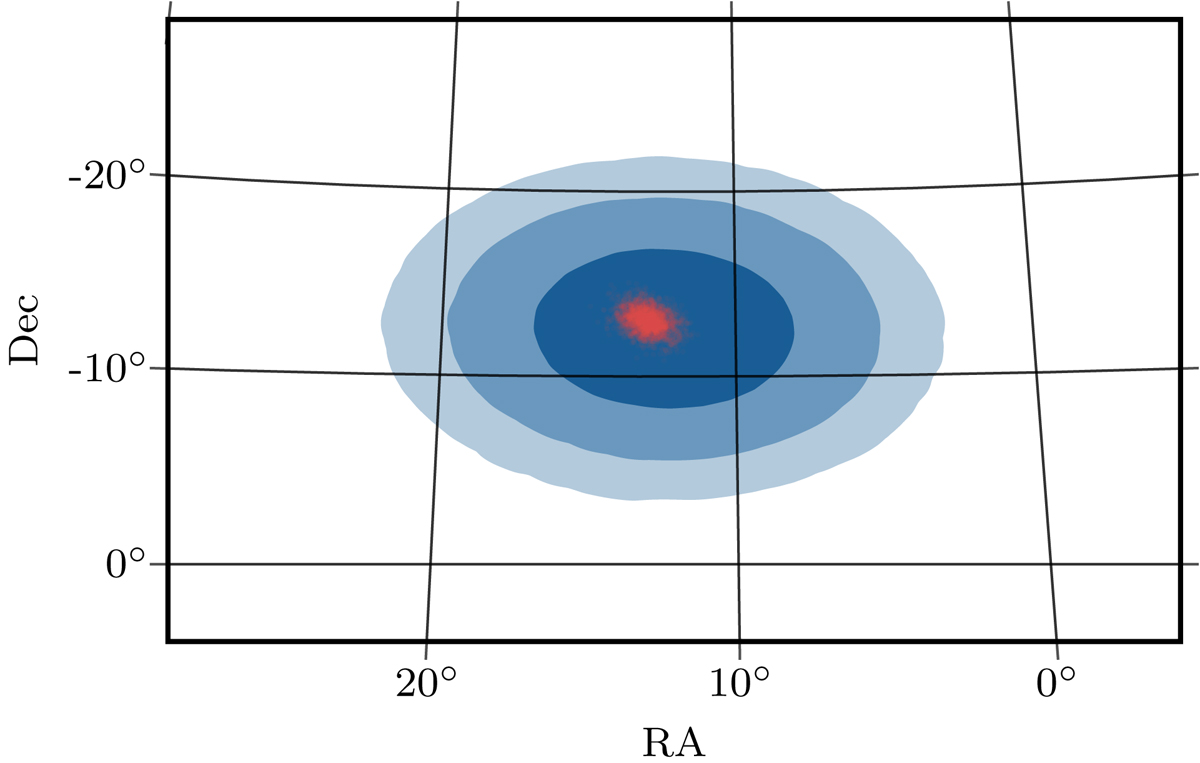
BALROG location (red posterior samples) of GRB 170114A derived by fitting the peak of the emission for both the location and spectrum simultaneously. The blue contours display the 1,2, and 3 σ standard GBM catalog location as obtained from the Fermi Science Support Center (FSSC).
Current usage metrics show cumulative count of Article Views (full-text article views including HTML views, PDF and ePub downloads, according to the available data) and Abstracts Views on Vision4Press platform.
Data correspond to usage on the plateform after 2015. The current usage metrics is available 48-96 hours after online publication and is updated daily on week days.
Initial download of the metrics may take a while.