Fig. 2.
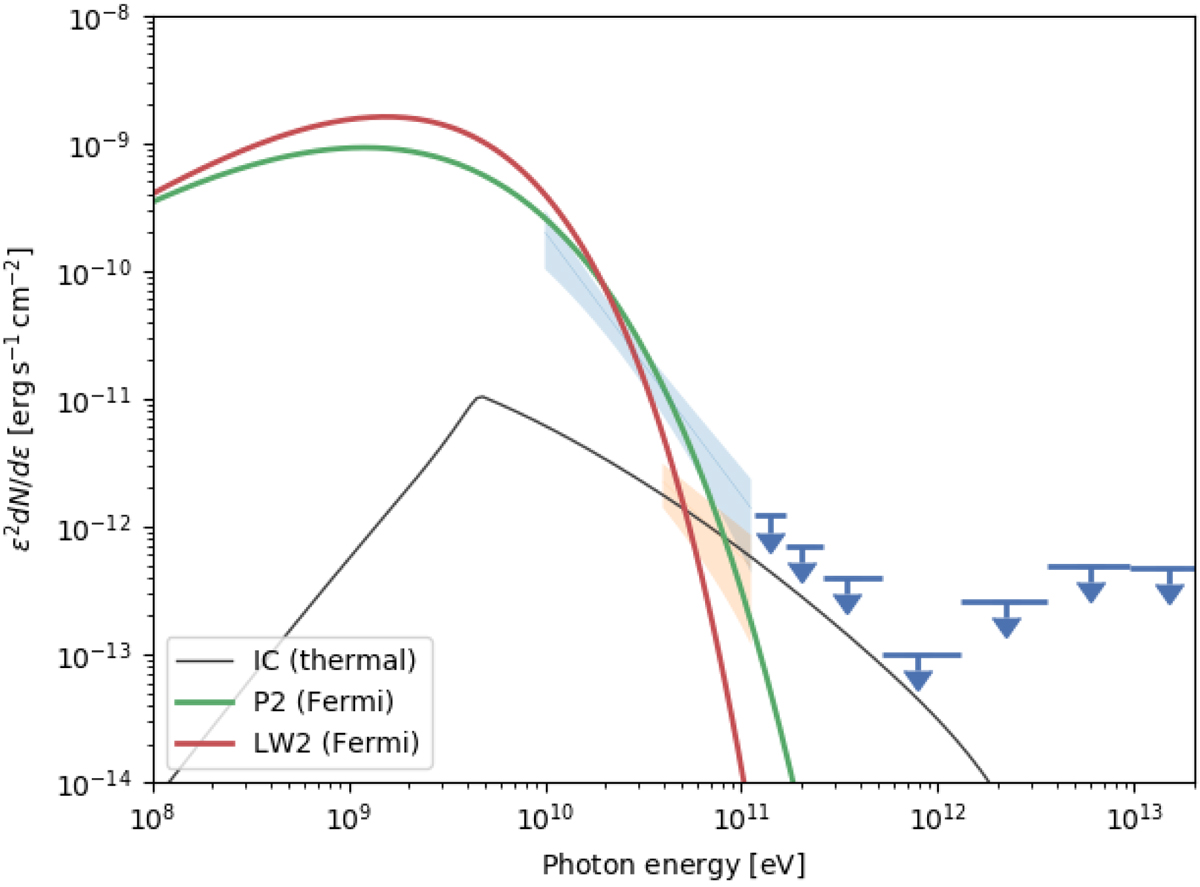
SED representation with best fits to the phase-resolved spectra based on ∼8 years of Fermi-LAT data (green and red lines) (Abdalla et al. 2018), along with a characteristic model calculation for the rotationally driven thermal IC contribution at VHE energies (black curve). The blue-shaded area represents results from power-law fits of recent H.E.S.S. II data in the range 10−110 GeV for P2 (Abdalla et al. 2018). Orange-shaded area indicates the range of H.E.S.S. II power-law indices inferred for LW2 (CII cuts). Blue upper limits denote early H.E.S.S. I constraints above 170 GeV (Aharonian et al. 2007). In this case rotationally driven IC γ-ray emission below 100 GeV may become detectable for LW2 but not P2.
Current usage metrics show cumulative count of Article Views (full-text article views including HTML views, PDF and ePub downloads, according to the available data) and Abstracts Views on Vision4Press platform.
Data correspond to usage on the plateform after 2015. The current usage metrics is available 48-96 hours after online publication and is updated daily on week days.
Initial download of the metrics may take a while.