Fig. 5.
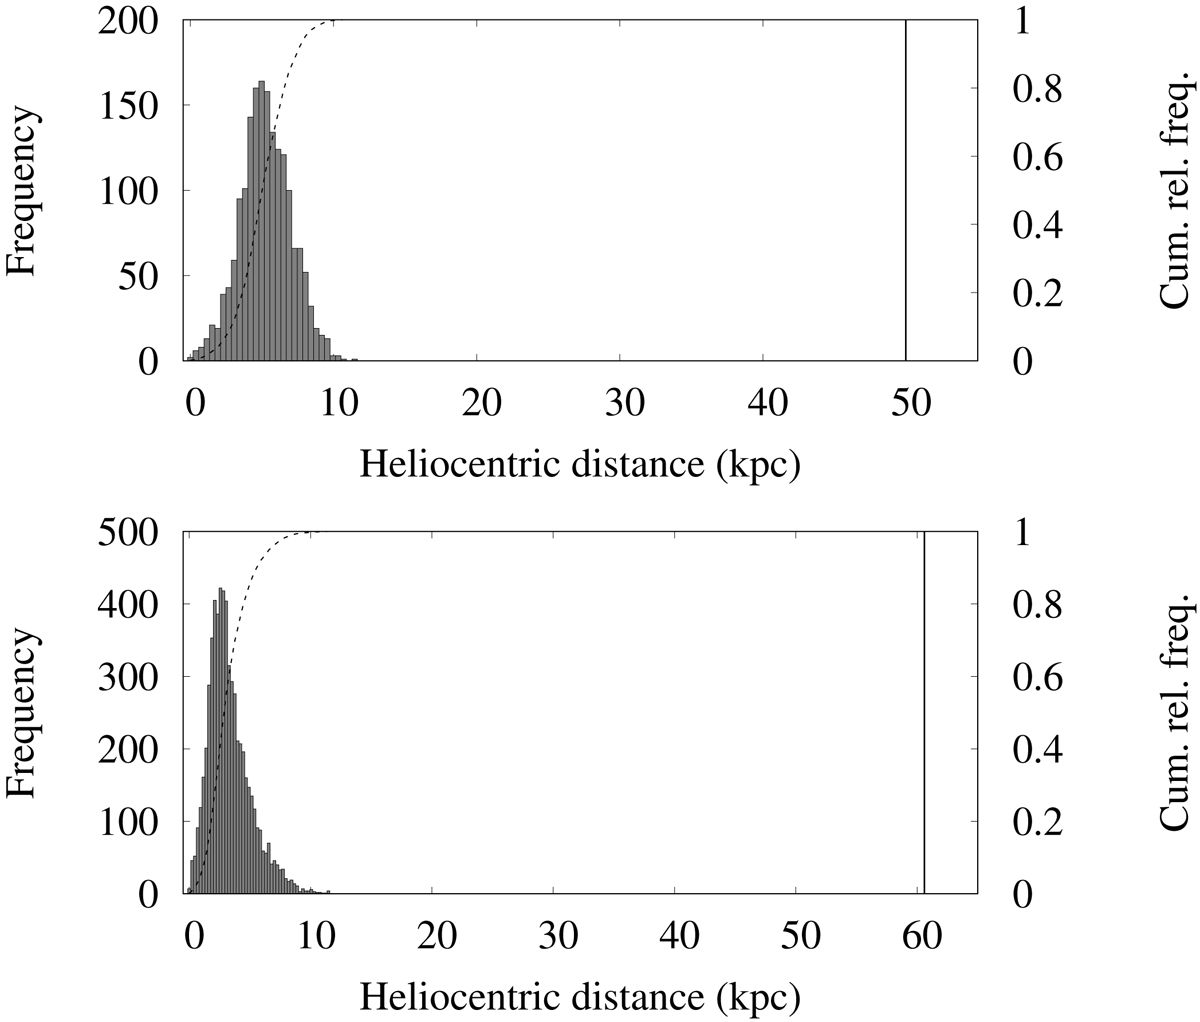
Distribution of Heliocentric distances. Results from Bailer-Jones et al. (2018) for sources in Muraveva et al. (2014), (top panel), and Pawlak et al. (2013), (bottom panel); the respective bin widths of the histograms are 0.38 kpc and 0.23 kpc (see the text for details). The vertical black bars signal the true values from Pietrzyński et al. (2013), (top panel), and Hilditch et al. (2005), (bottom panel). The cumulative relative frequency is plotted as a discontinuous curve.
Current usage metrics show cumulative count of Article Views (full-text article views including HTML views, PDF and ePub downloads, according to the available data) and Abstracts Views on Vision4Press platform.
Data correspond to usage on the plateform after 2015. The current usage metrics is available 48-96 hours after online publication and is updated daily on week days.
Initial download of the metrics may take a while.