Fig. 4.
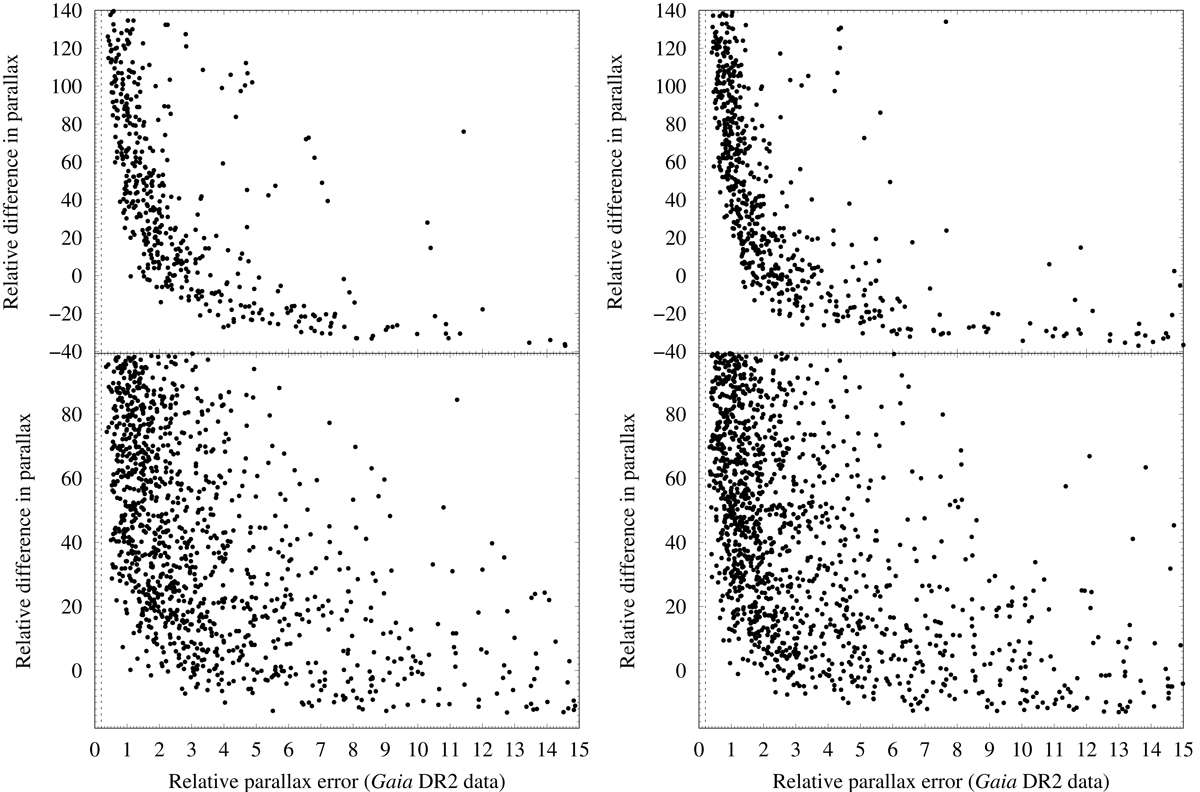
Eddington-Trumpler-Weaver bias. Evaluation of this bias for data from Muraveva et al. (2014), (top panel), and Pawlak et al. (2013), (bottom panel). The y-axis shows the difference between the value of the parallax from Gaia DR2 and the one derived from the assumed distance – 0.0208 ± 0.0005 mas for the LMC (top panel, Pietrzyński et al. 2013) and 0.0165 ± 0.0010 mas for the SMC (bottom panel, Hilditch et al. 2005)— divided by the quoted uncertainty (0.0005 mas, top panel, and 0.0010 mas, bottom panel). The x-axis shows the corresponding value of the relative error in parallax from Gaia DR2. Only sources with strictly positive values of the parallax are plotted; a sample of the full catalogues is shown as the full ranges in x and y are wider. The condition σπ/π = 0.2 is plotted as a discontinuous line. Left panels: results without considering any global zero-point correction; right panels: include the correction (π + 0.029 mas) discussed in the text.
Current usage metrics show cumulative count of Article Views (full-text article views including HTML views, PDF and ePub downloads, according to the available data) and Abstracts Views on Vision4Press platform.
Data correspond to usage on the plateform after 2015. The current usage metrics is available 48-96 hours after online publication and is updated daily on week days.
Initial download of the metrics may take a while.