Fig. 3.
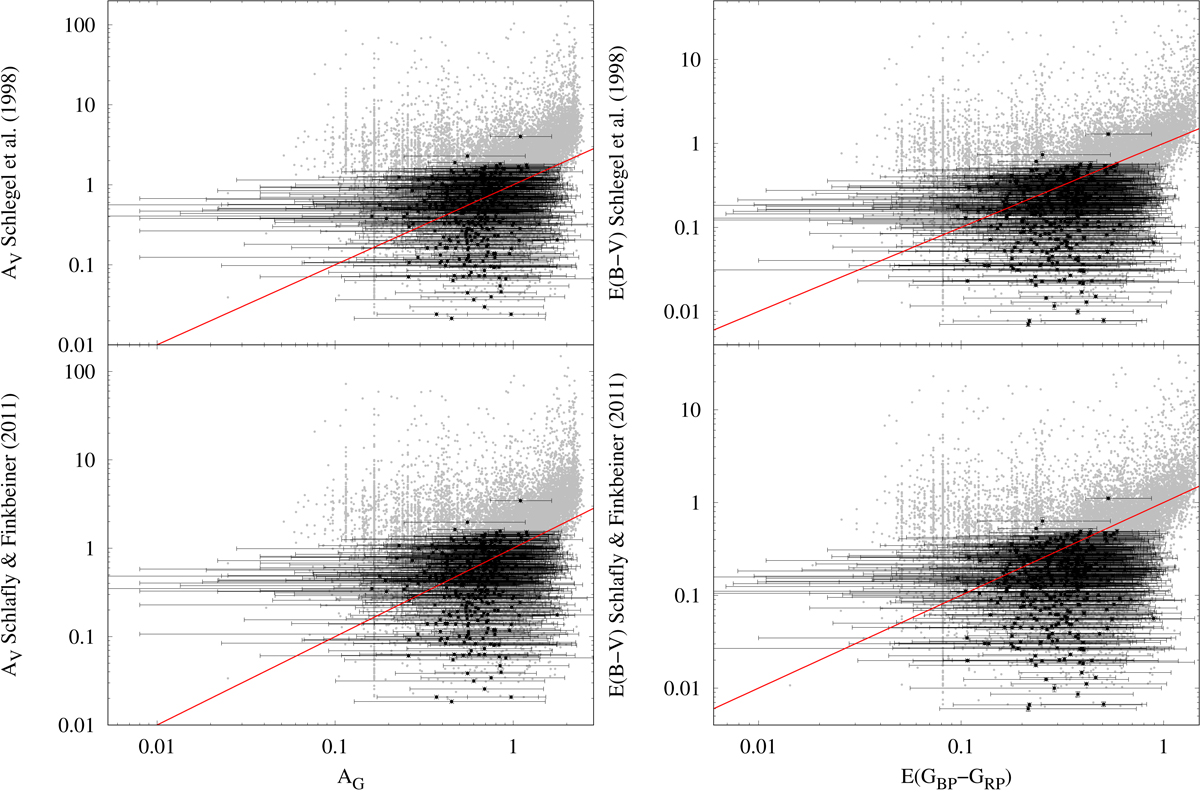
Extinction and reddening, a comparison. Left panels: extinction values AV from Schlegel et al. (1998), (top panels), and Schlafly & Finkbeiner (2011), (bottom panels), versus the line-of-sight extinction AG from Gaia DR2 for the 15 681 sources in our primary sample (in grey) and the 393 stars with the best astrometric solutions (in black). Right panels: colour excesses E(B − V) from Schlegel et al. (1998) and Schlafly & Finkbeiner (2011) versus E(GBP − GRP) from Gaia DR2 for the same sources. The reference line in red is the diagonal. See the text for additional details.
Current usage metrics show cumulative count of Article Views (full-text article views including HTML views, PDF and ePub downloads, according to the available data) and Abstracts Views on Vision4Press platform.
Data correspond to usage on the plateform after 2015. The current usage metrics is available 48-96 hours after online publication and is updated daily on week days.
Initial download of the metrics may take a while.