Fig. 10.
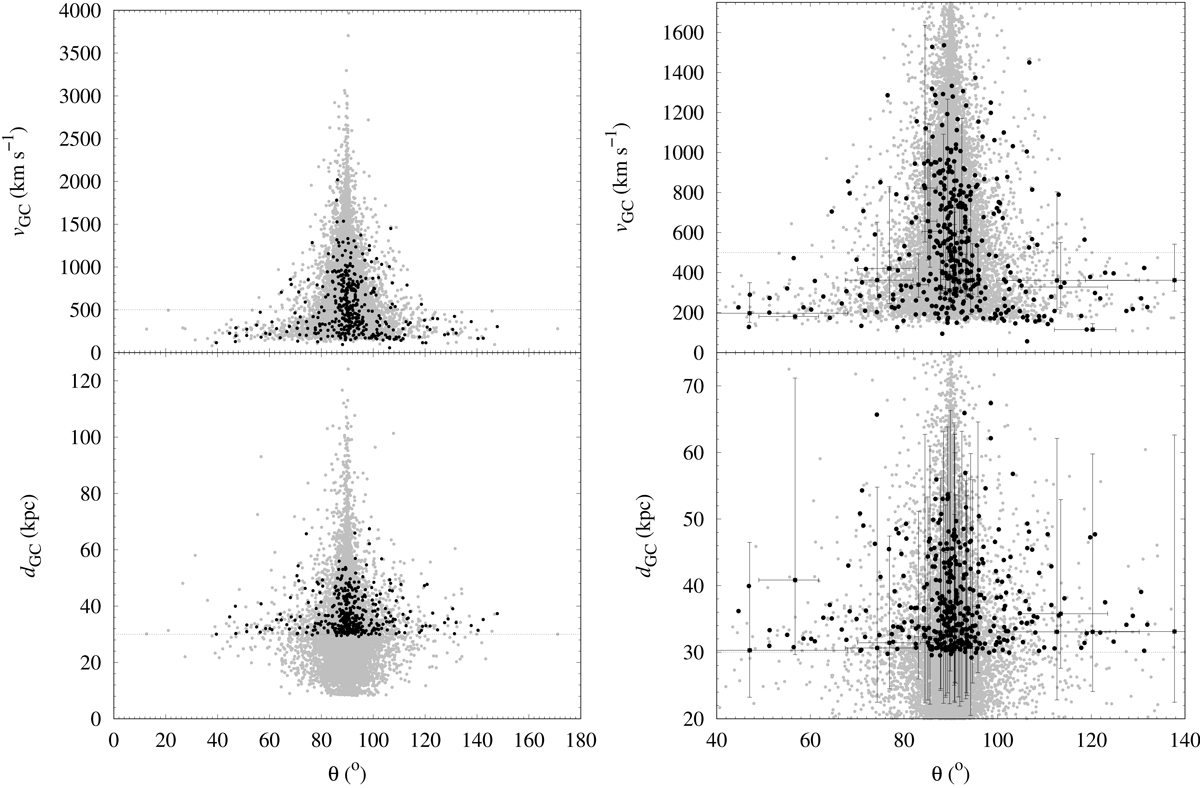
Distances, velocities, and angles. Distribution of Galactocentric distances and velocities as a function of the angle between the Galactocentric position and velocity vectors for the full sample (in grey) of 15 681 sources and the one of 393 sources (in black) with the best astrometric solutions (left panels). The magnified version of the same data plot (right panels) includes the error bars for those sources with ratio between the value of the parallax and its uncertainty >2. Our lower cut-off limits, 500 km s−1 and 30 kpc, are indicated by a discontinuous line on each panel.
Current usage metrics show cumulative count of Article Views (full-text article views including HTML views, PDF and ePub downloads, according to the available data) and Abstracts Views on Vision4Press platform.
Data correspond to usage on the plateform after 2015. The current usage metrics is available 48-96 hours after online publication and is updated daily on week days.
Initial download of the metrics may take a while.