Free Access
Fig. 1.
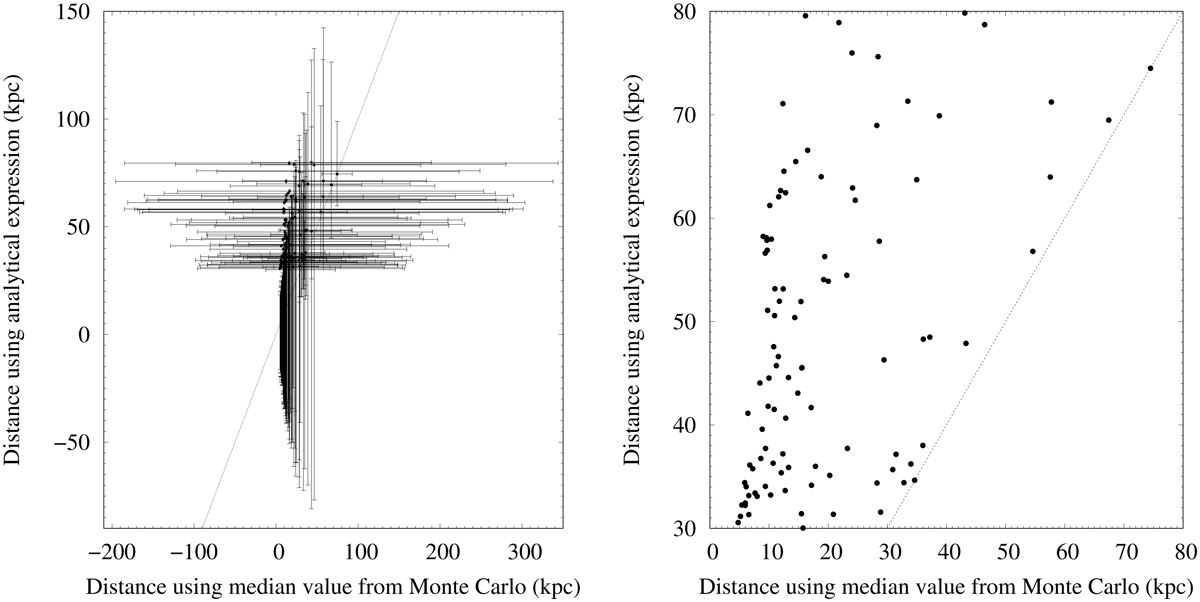
Analytical versus Monte Carlo distances for 100 representative synthetic data with σπ/π ∈ [0.2, 4.2] and π ∈ [0.0125, 0.0333] mas (uniformly distributed). These are shown with (left) and without (right) error bars, computed as described in the text. The discontinuous line shows the diagonal (d = dc) for reference.
Current usage metrics show cumulative count of Article Views (full-text article views including HTML views, PDF and ePub downloads, according to the available data) and Abstracts Views on Vision4Press platform.
Data correspond to usage on the plateform after 2015. The current usage metrics is available 48-96 hours after online publication and is updated daily on week days.
Initial download of the metrics may take a while.