Fig. 9
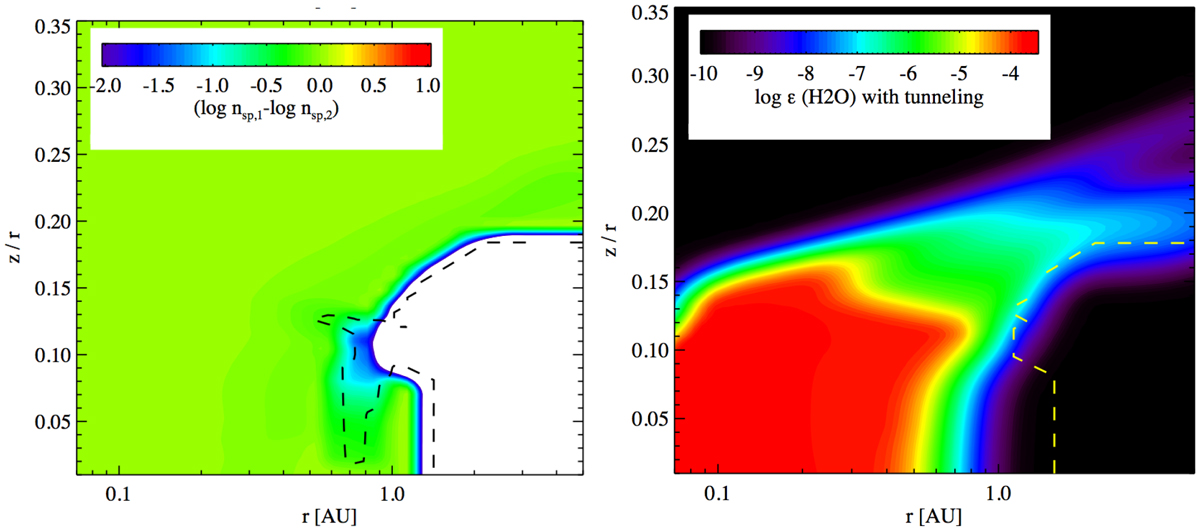
Difference in water density (left) between the reference T Tauri model (nsp,1) and the model with new rate constants with accurate description of atom tunneling (nsp,2) for the reaction H2 + OH → H2O + H according to Table 2. The black dashed line shows a difference of 0.5 dex in water abundance in the T Tauri disk model that uses the new rate constants (right); this is to be compared to Fig. 5 (we note the different scale). The yellow dashed contour outlines the region below which 300 monolayers of ice exist.
Current usage metrics show cumulative count of Article Views (full-text article views including HTML views, PDF and ePub downloads, according to the available data) and Abstracts Views on Vision4Press platform.
Data correspond to usage on the plateform after 2015. The current usage metrics is available 48-96 hours after online publication and is updated daily on week days.
Initial download of the metrics may take a while.