Fig. 8
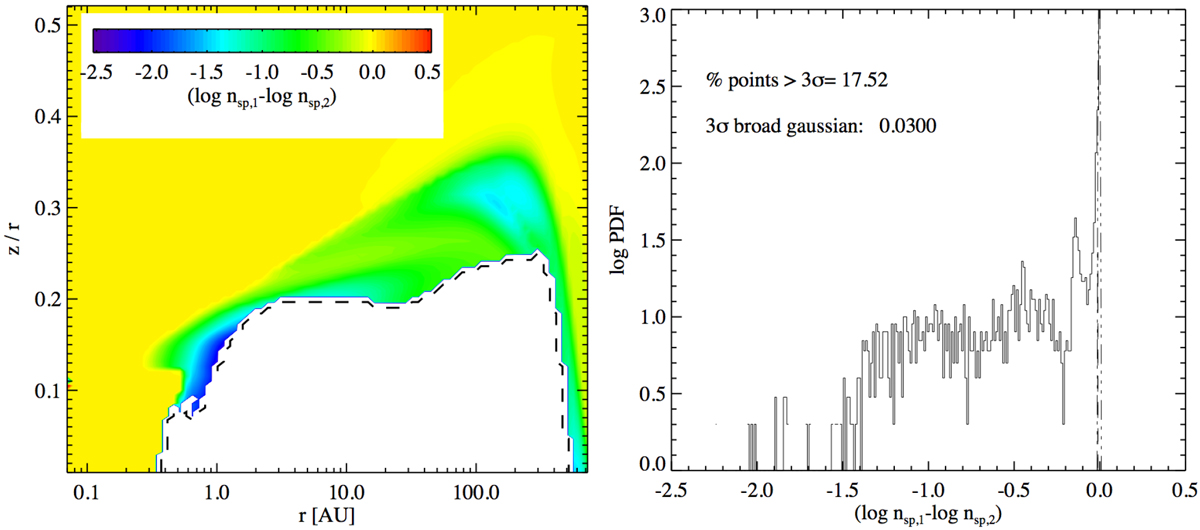
Screening test. Left: Difference in HCN species density between the reference model (nsp,1) and the model with modified reaction H2 + CN → HCN + H (nsp,2, reaction [24]). The black dashed line indicates the surface of the ice reservoir excluded from the statistical analysis. Right: Distribution function of abundance differences with Gaussian fit to the numerical noise (dash-triple-dotted line).
Current usage metrics show cumulative count of Article Views (full-text article views including HTML views, PDF and ePub downloads, according to the available data) and Abstracts Views on Vision4Press platform.
Data correspond to usage on the plateform after 2015. The current usage metrics is available 48-96 hours after online publication and is updated daily on week days.
Initial download of the metrics may take a while.