Free Access
Fig. 5
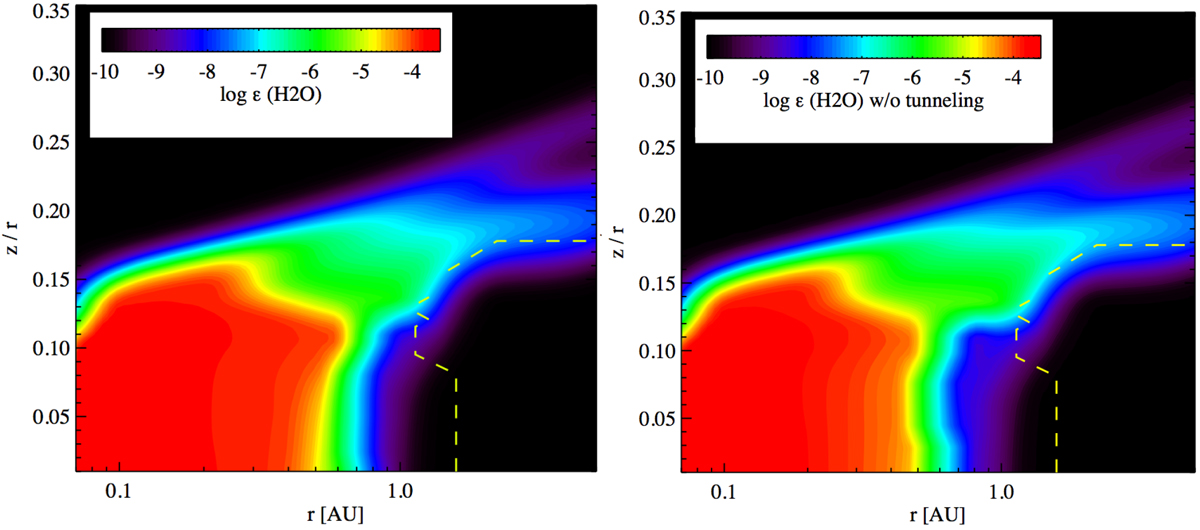
Left: Water abundance in the T Tauri disk model using the rate constant for H2 + OH → H2O + H from UMIST2012. Right: Same, but now using a rate constant calculated without tunneling. The yellow dashed contour outlines the region below which 300 monolayers of ice exist.
Current usage metrics show cumulative count of Article Views (full-text article views including HTML views, PDF and ePub downloads, according to the available data) and Abstracts Views on Vision4Press platform.
Data correspond to usage on the plateform after 2015. The current usage metrics is available 48-96 hours after online publication and is updated daily on week days.
Initial download of the metrics may take a while.