Free Access
Fig. 3
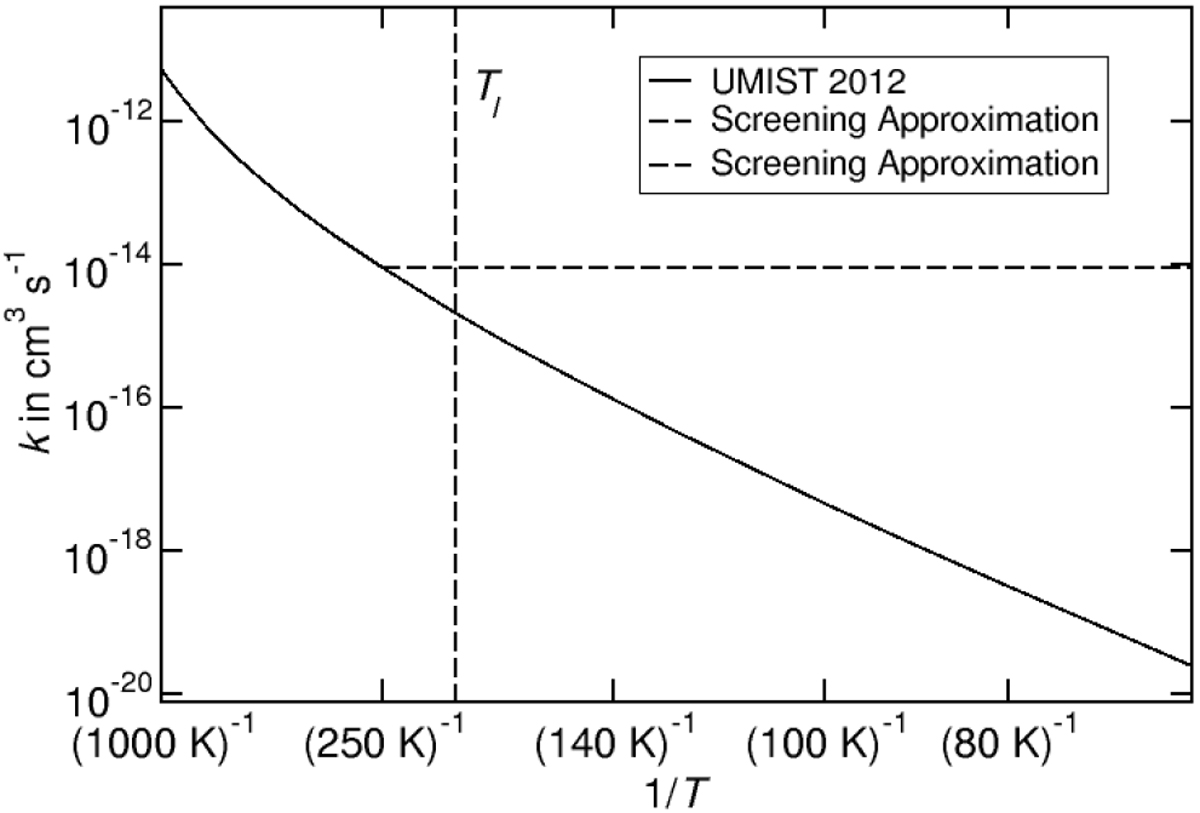
Arrhenius plot for the reaction H2 + CN → HCN + H. The solid line shows the UMIST2012 data; the dashed line represents the modification of the rate constants from 250 K on. The vertical dashed line indicates the lower temperature bound at which the measured or calculated data has been fitted: Tl = 200 K.
Current usage metrics show cumulative count of Article Views (full-text article views including HTML views, PDF and ePub downloads, according to the available data) and Abstracts Views on Vision4Press platform.
Data correspond to usage on the plateform after 2015. The current usage metrics is available 48-96 hours after online publication and is updated daily on week days.
Initial download of the metrics may take a while.