Fig. 2
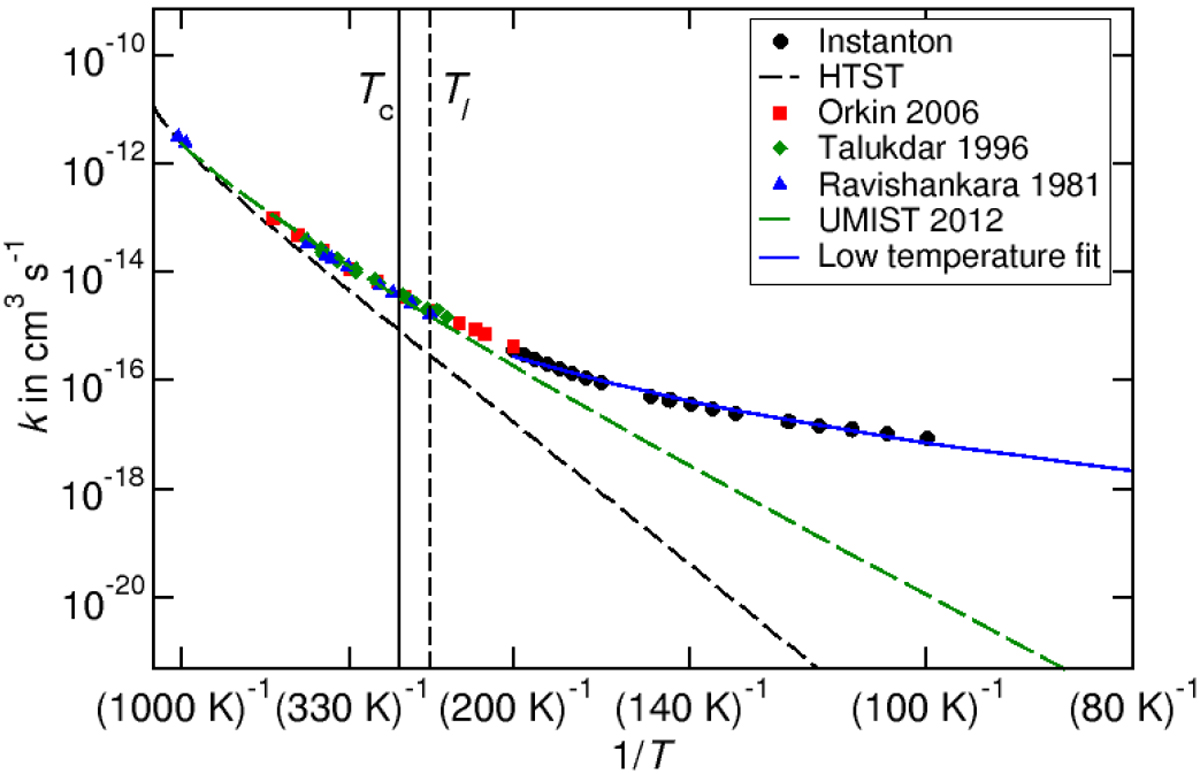
Arrhenius plot for the reaction H2 + OH → H2O + H. The low-temperature fit (blue solid line) was performed using the rate constants calculated using the instanton theory by Meisner & Kästner (2016b). Experimental values are from Ravishankara et al. (1981), Talukdar et al. (1996), and Orkin et al. (2006). The vertical dashed line indicates the lower bound for the recommended temperature range of the UMIST2012 database, Tl = 250 K. Reprinted (modified) with permission from (Meisner & Kästner 2016b), Copyright (2016) American Institute of Physics.
Current usage metrics show cumulative count of Article Views (full-text article views including HTML views, PDF and ePub downloads, according to the available data) and Abstracts Views on Vision4Press platform.
Data correspond to usage on the plateform after 2015. The current usage metrics is available 48-96 hours after online publication and is updated daily on week days.
Initial download of the metrics may take a while.