Fig. 10
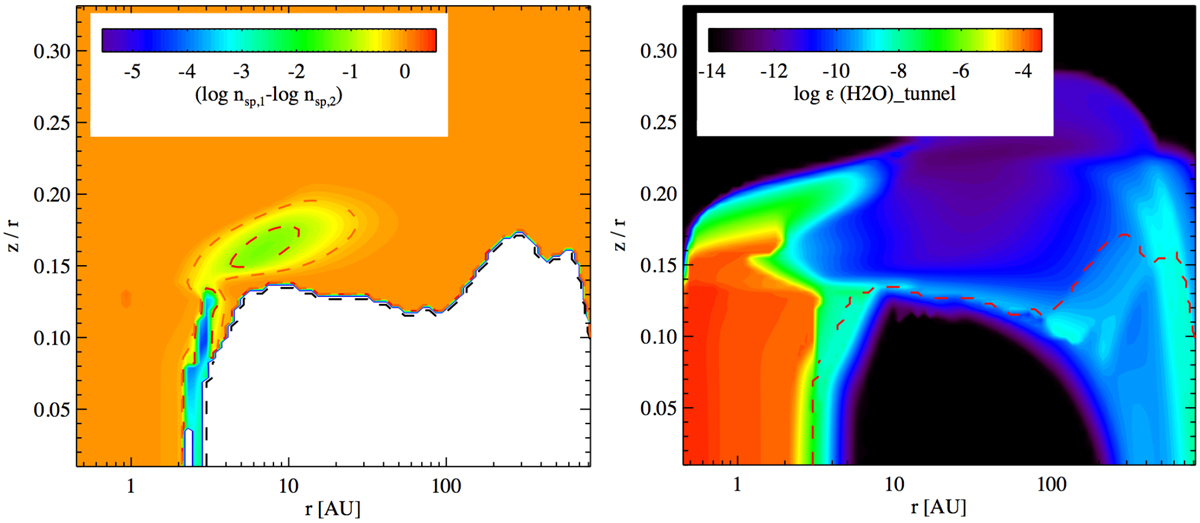
Difference in water density between the reference Herbig model (nsp,1) and the model with new rate constants with accurate description of atom tunneling (nsp,2) for the reaction H2 + OH → H2O + H according to Table 2. The black dashed line indicates the surface of the ice reservoir excluded from the statistical analysis, the red dashed line a change in species density of a factor of three. Water abundance (right) in the Herbig disk model that uses the new rate constants; the red dashed line indicates the surface of the ice reservoir.
Current usage metrics show cumulative count of Article Views (full-text article views including HTML views, PDF and ePub downloads, according to the available data) and Abstracts Views on Vision4Press platform.
Data correspond to usage on the plateform after 2015. The current usage metrics is available 48-96 hours after online publication and is updated daily on week days.
Initial download of the metrics may take a while.