Free Access
Fig. 8
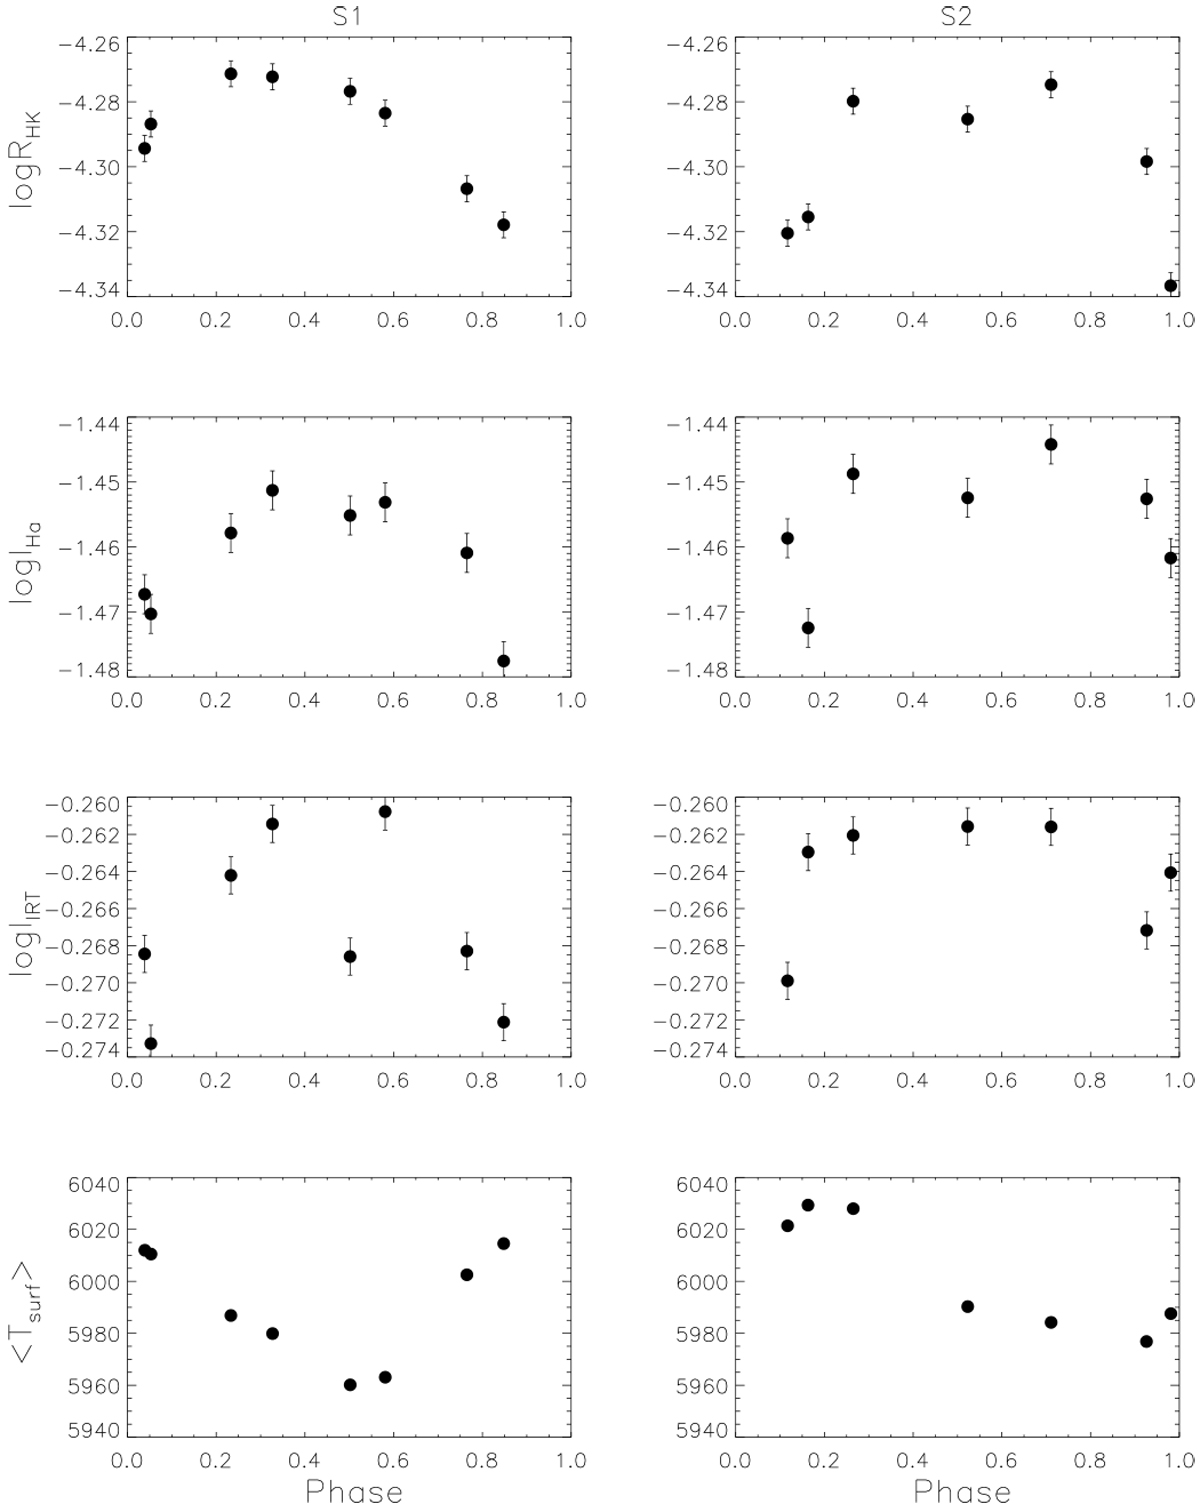
Calcium RHK (top panels), Hα (second row), and Ca II IRT (third row) curves for the two rotations compared to the average projected surface-temperatures for the same rotational phases from Doppler imaging (bottom panels).
Current usage metrics show cumulative count of Article Views (full-text article views including HTML views, PDF and ePub downloads, according to the available data) and Abstracts Views on Vision4Press platform.
Data correspond to usage on the plateform after 2015. The current usage metrics is available 48-96 hours after online publication and is updated daily on week days.
Initial download of the metrics may take a while.