Fig. 9
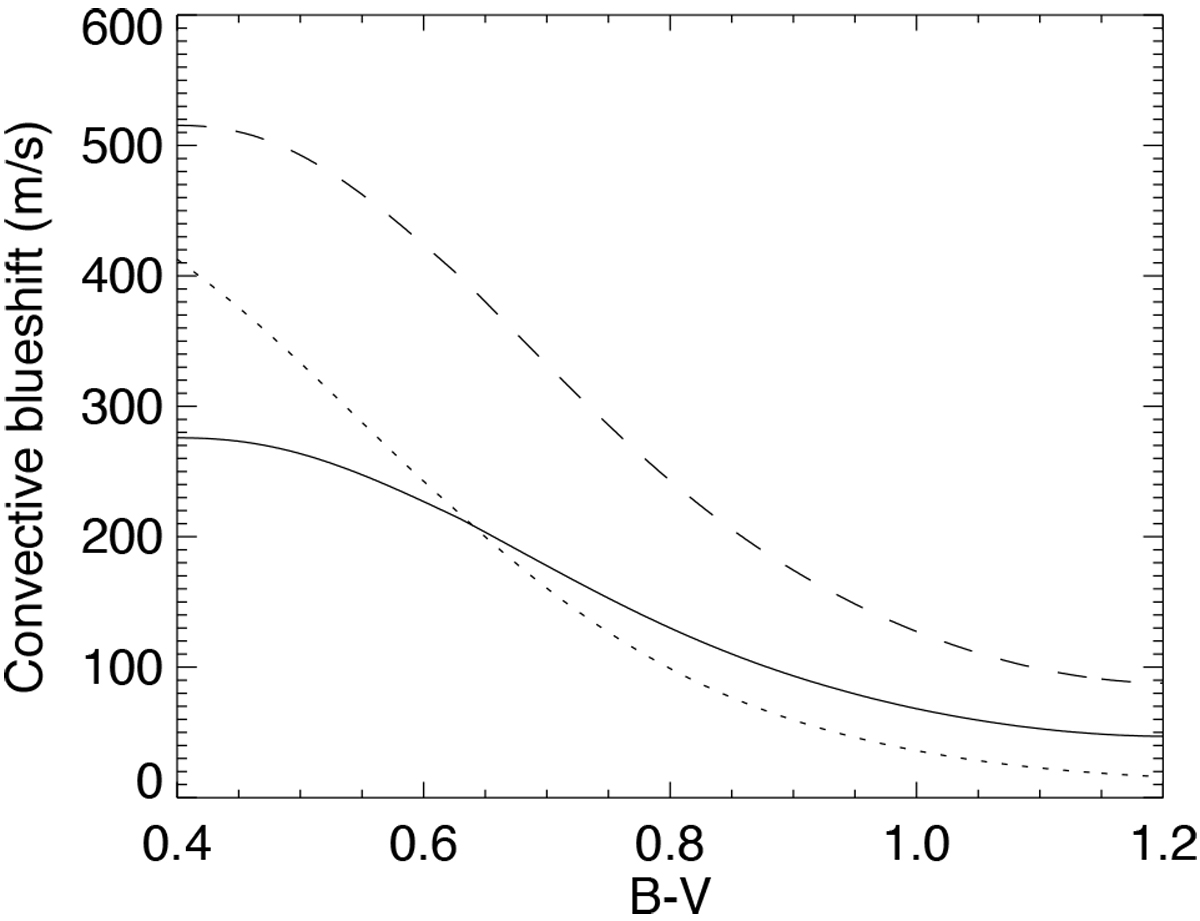
Convective blueshift derived for the basal Log ![]() (dashed line), adapted from Meunier et al. (2017b), and scaled with the solar values derived in
Meunier et al. (2017a). The solid line shows the local convective blueshift we used in our model, after correction for projection effects for a constant attenuation of the convective blueshift in plages of 0.38 (see text). The dotted line shows the same parameter when the trend of the attenuation factor vs.
Teff is taken intoaccount.
(dashed line), adapted from Meunier et al. (2017b), and scaled with the solar values derived in
Meunier et al. (2017a). The solid line shows the local convective blueshift we used in our model, after correction for projection effects for a constant attenuation of the convective blueshift in plages of 0.38 (see text). The dotted line shows the same parameter when the trend of the attenuation factor vs.
Teff is taken intoaccount.
Current usage metrics show cumulative count of Article Views (full-text article views including HTML views, PDF and ePub downloads, according to the available data) and Abstracts Views on Vision4Press platform.
Data correspond to usage on the plateform after 2015. The current usage metrics is available 48-96 hours after online publication and is updated daily on week days.
Initial download of the metrics may take a while.