Fig. 7
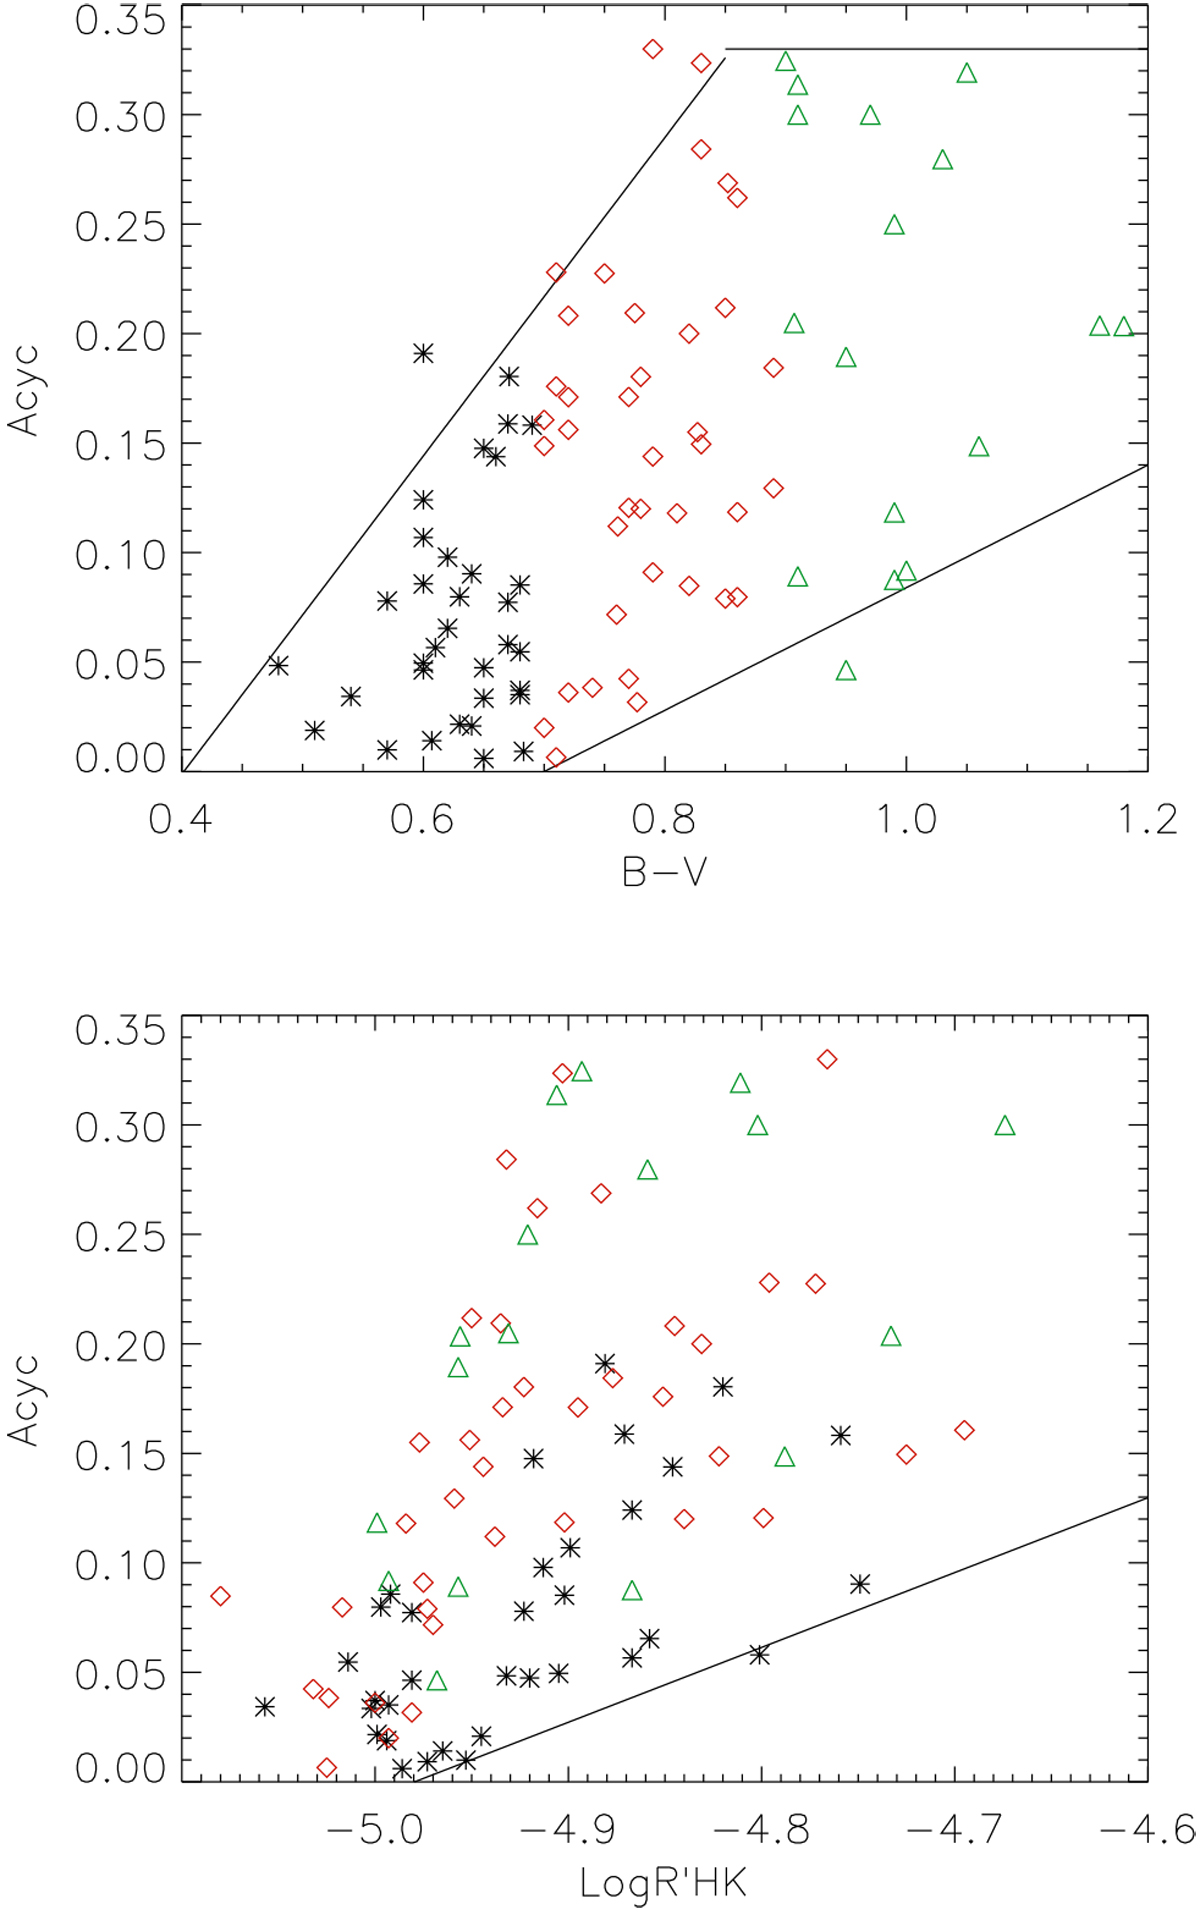
Upper panel: half full amplitude of stellar cycles vs. B–V, derived from Lovis et al. (2011) after revision of the largest amplitudes (see text) for different types of stars:
B–V
< 0.7 (black stars), 0.7 <
B–V < 0.9 (red squares), and B–V
> 0.9 (green triangles). The black lines correspond to the lower and upper boundaries that were taken into account in building the grid. Upper panel: same vs. average Log ![]() . The solid line represents the lower limit that was taken into account in building the grid.
. The solid line represents the lower limit that was taken into account in building the grid.
Current usage metrics show cumulative count of Article Views (full-text article views including HTML views, PDF and ePub downloads, according to the available data) and Abstracts Views on Vision4Press platform.
Data correspond to usage on the plateform after 2015. The current usage metrics is available 48-96 hours after online publication and is updated daily on week days.
Initial download of the metrics may take a while.