Fig. 3
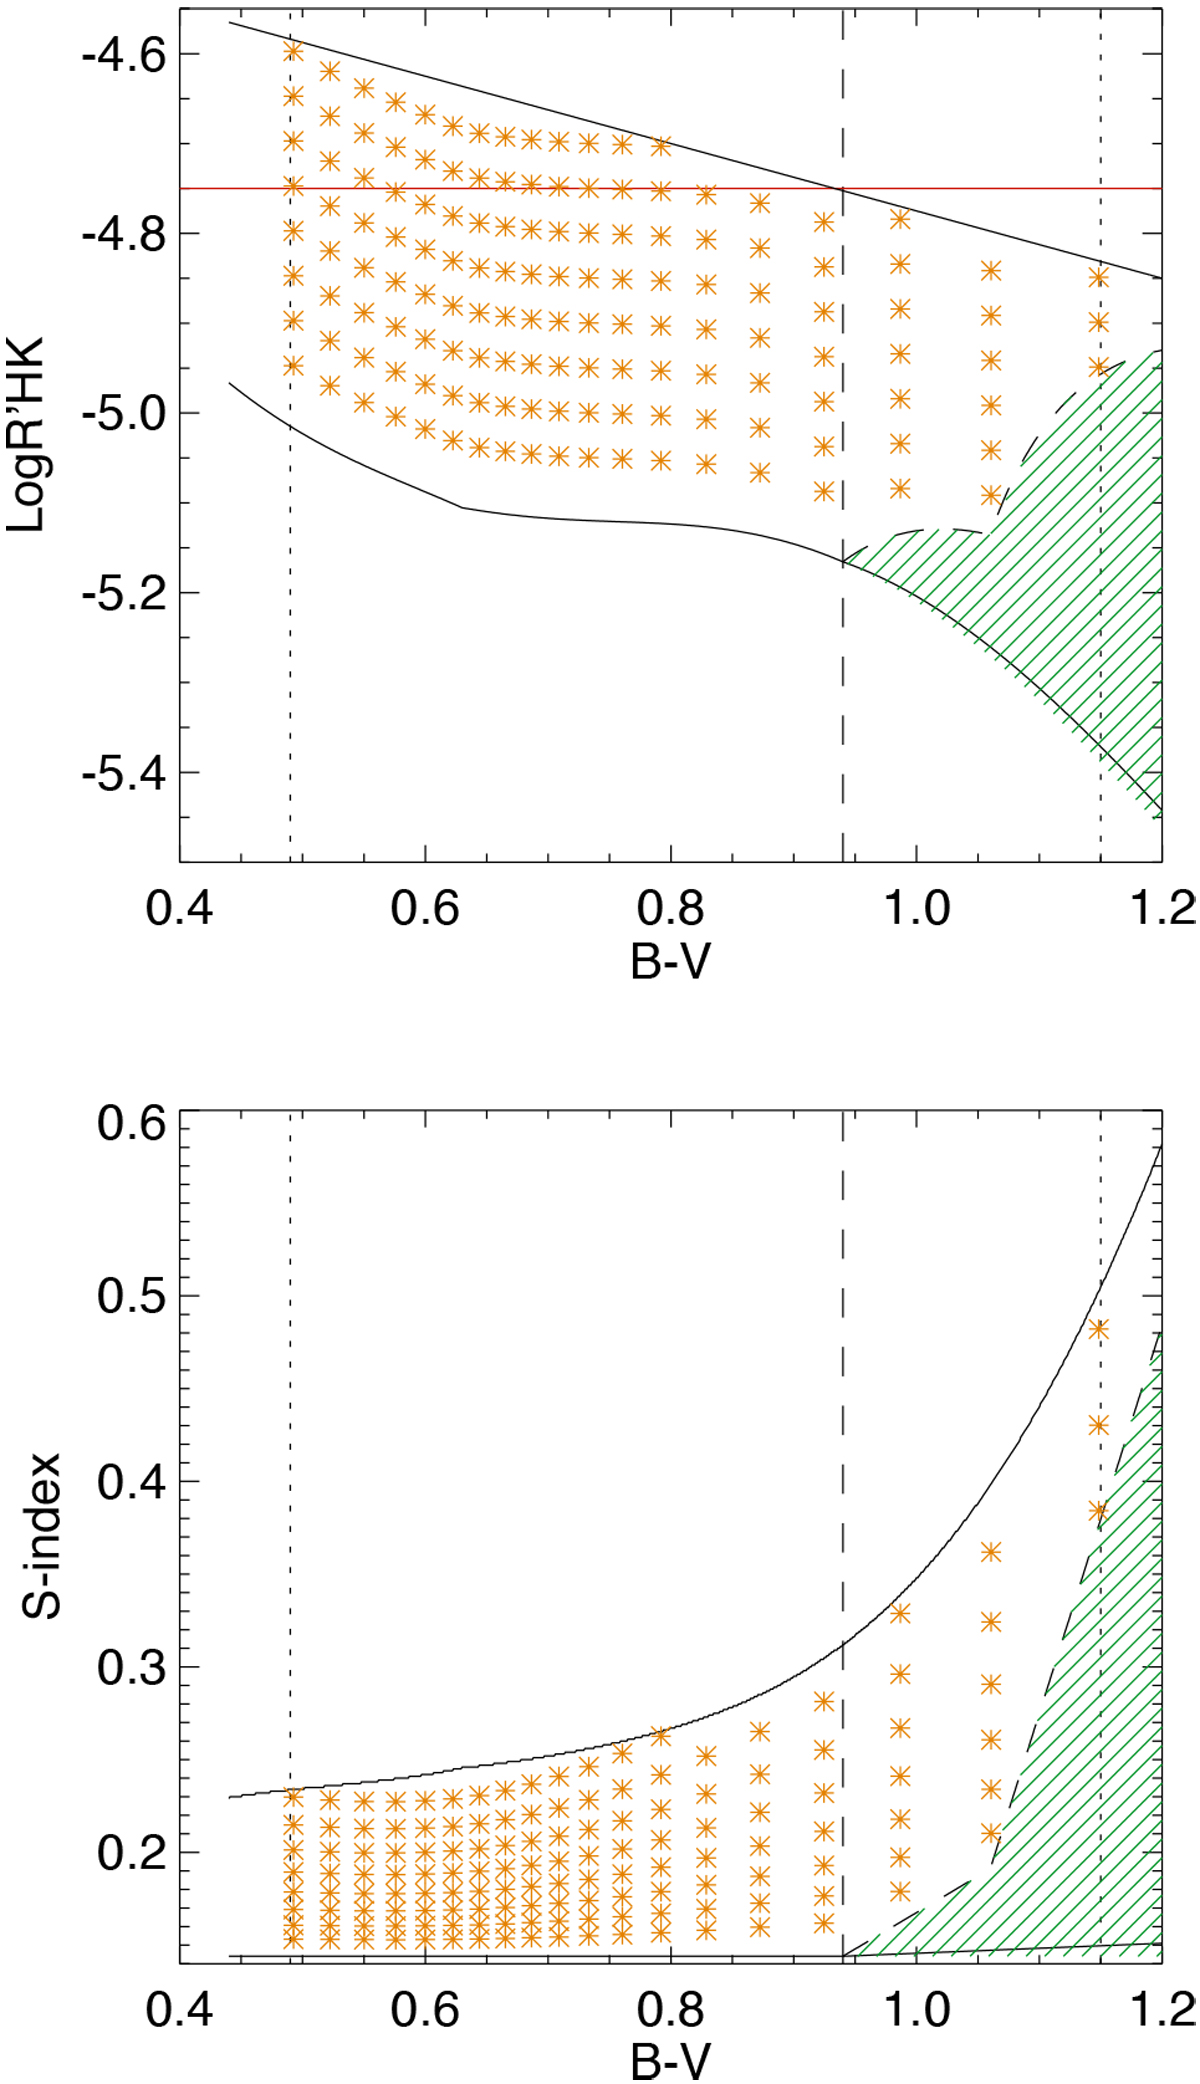
Upper panel: average Log ![]() versus B–V representing our 2D grid (orange stars). The lower solid line shows the basal flux used in this paper, from Mittag et al. (2013) and Schröder et al. (2012) and the upper solid line shows the upper bound for the activity level versus
B–V, from Lockwood et al. (2007). The dashed line corresponds to the minimum Log
versus B–V representing our 2D grid (orange stars). The lower solid line shows the basal flux used in this paper, from Mittag et al. (2013) and Schröder et al. (2012) and the upper solid line shows the upper bound for the activity level versus
B–V, from Lockwood et al. (2007). The dashed line corresponds to the minimum Log ![]() we consider for stars with B–V above 0.94. The vertical dotted lines show the range in B–V covered by our simulations, the vertical dashed line vizualises B–V = 0.94, and the red horizontal line approximately corresponds to the Vaughan-Preston gap (see text). Lower panel: same for the S-index versus B–V.
we consider for stars with B–V above 0.94. The vertical dotted lines show the range in B–V covered by our simulations, the vertical dashed line vizualises B–V = 0.94, and the red horizontal line approximately corresponds to the Vaughan-Preston gap (see text). Lower panel: same for the S-index versus B–V.
Current usage metrics show cumulative count of Article Views (full-text article views including HTML views, PDF and ePub downloads, according to the available data) and Abstracts Views on Vision4Press platform.
Data correspond to usage on the plateform after 2015. The current usage metrics is available 48-96 hours after online publication and is updated daily on week days.
Initial download of the metrics may take a while.