Fig. A.1
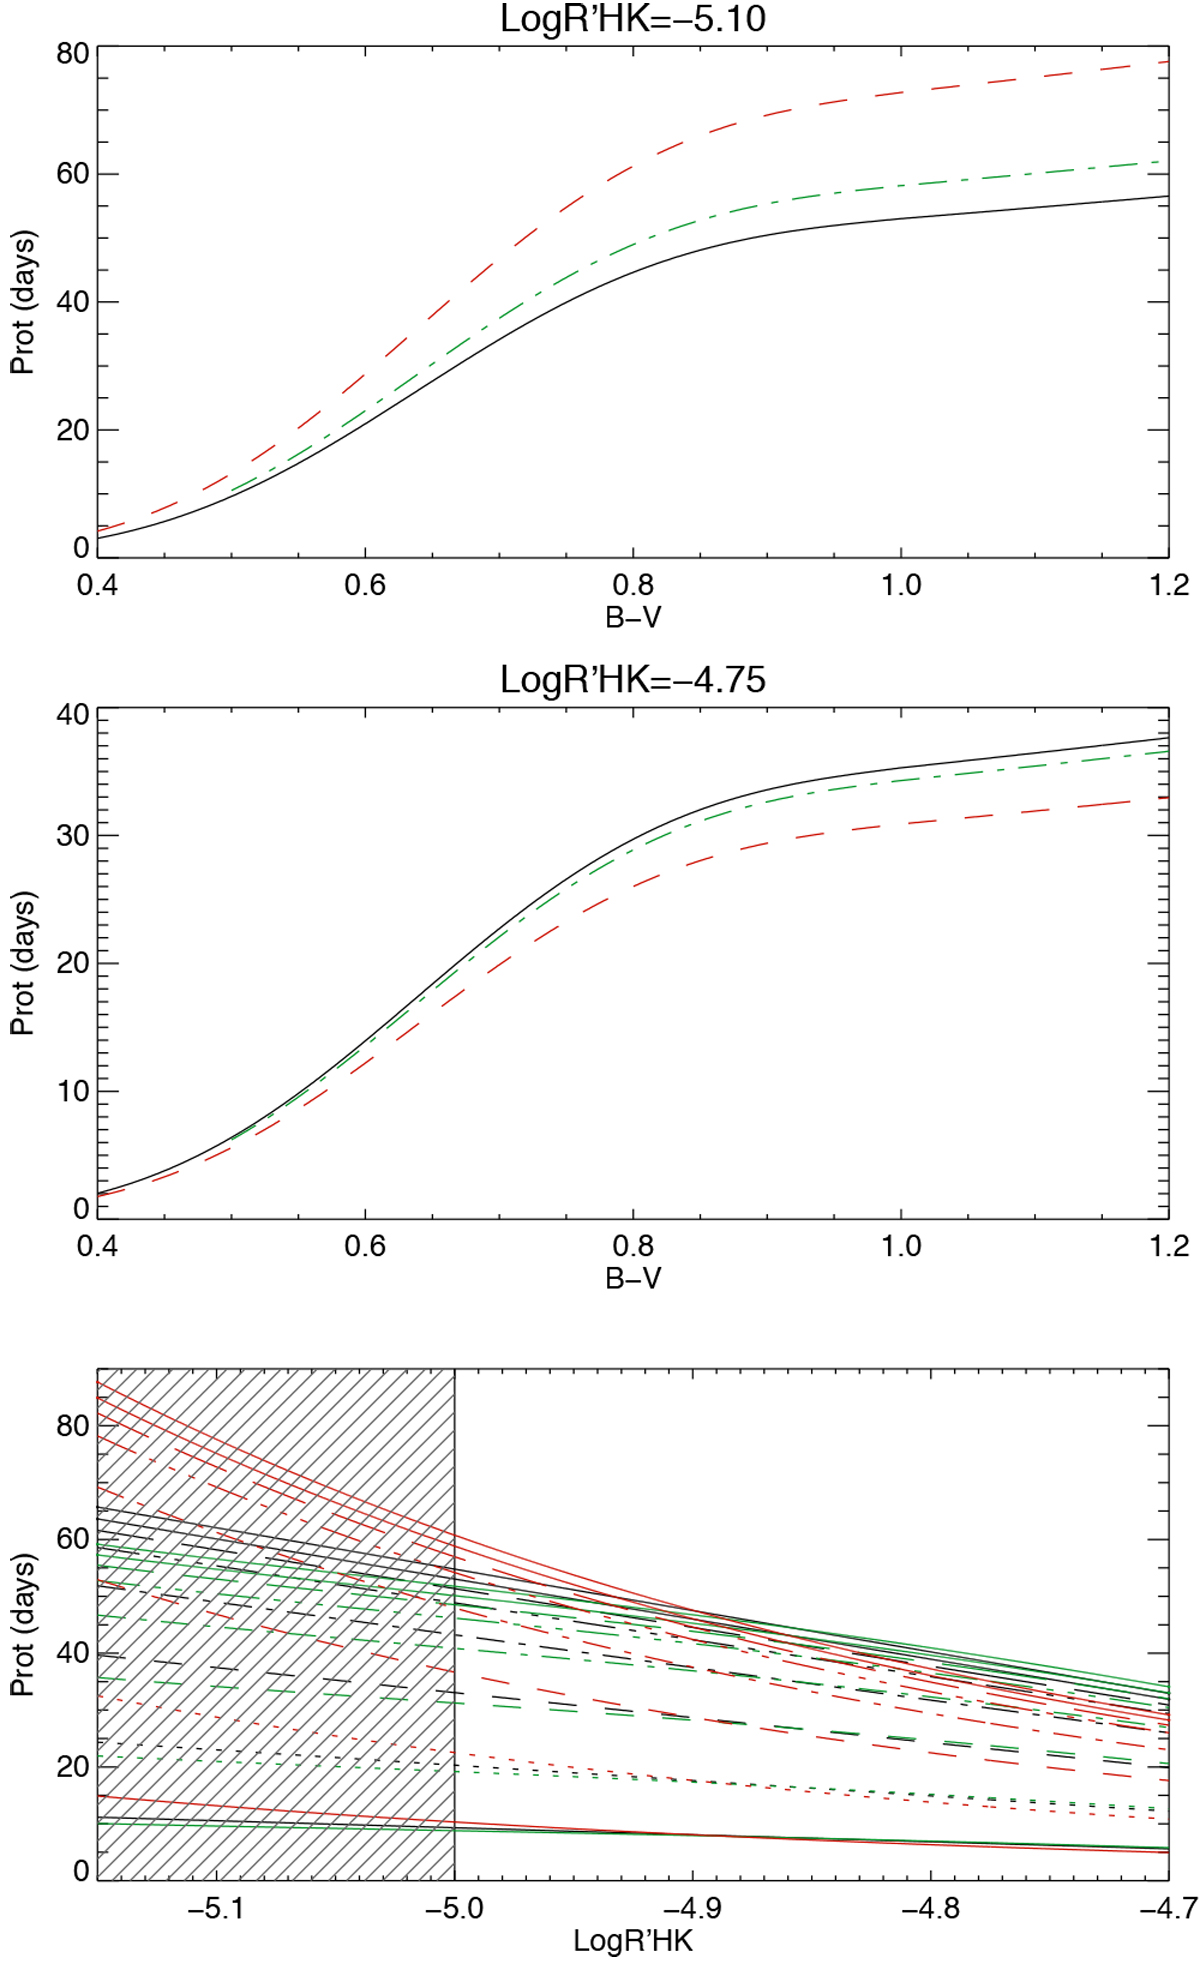
First panel: Comparison of the rotation period vs. B–V for Log ![]() = −5.1 from various sources: the solid black line is from Mamajek & Hillenbrand (2008), the green dot-dashed line from Noyes et al. (1984a), and the dashed red line from Saar & Brandenburg (1999). Second panel: Same for Log
= −5.1 from various sources: the solid black line is from Mamajek & Hillenbrand (2008), the green dot-dashed line from Noyes et al. (1984a), and the dashed red line from Saar & Brandenburg (1999). Second panel: Same for Log ![]() = −4.75.
Third panel: Similar comparison vs. Log
= −4.75.
Third panel: Similar comparison vs. Log ![]() for eight levels in B–V between 0.5 and 1.1. The vertical line approximately shows the lower limit for the validity of the laws (the shaded area indicates the zones where it is not valid).
for eight levels in B–V between 0.5 and 1.1. The vertical line approximately shows the lower limit for the validity of the laws (the shaded area indicates the zones where it is not valid).
Current usage metrics show cumulative count of Article Views (full-text article views including HTML views, PDF and ePub downloads, according to the available data) and Abstracts Views on Vision4Press platform.
Data correspond to usage on the plateform after 2015. The current usage metrics is available 48-96 hours after online publication and is updated daily on week days.
Initial download of the metrics may take a while.