Fig. 8.
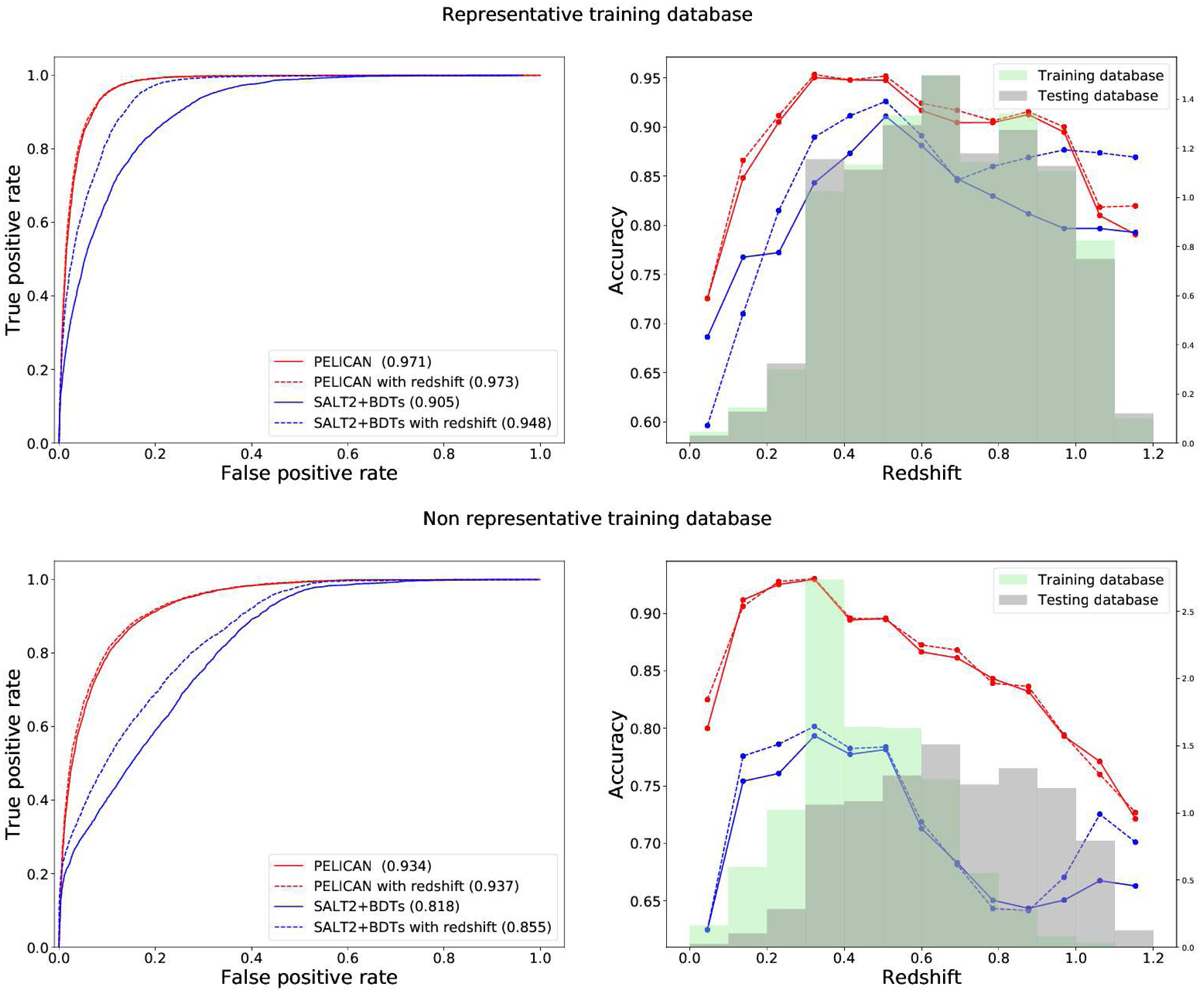
Comparison of ROC curves with the AUC score in brackets (left panels) and the accuracy versus redshift (right panels) for PELICAN (in red) and the BDTs method (in blue), with (solid lines) and without (dashed lines) the redshift included in the training. The representative case is on the first line and the non-representative one on the second line.
Current usage metrics show cumulative count of Article Views (full-text article views including HTML views, PDF and ePub downloads, according to the available data) and Abstracts Views on Vision4Press platform.
Data correspond to usage on the plateform after 2015. The current usage metrics is available 48-96 hours after online publication and is updated daily on week days.
Initial download of the metrics may take a while.