Open Access
Fig. 2.
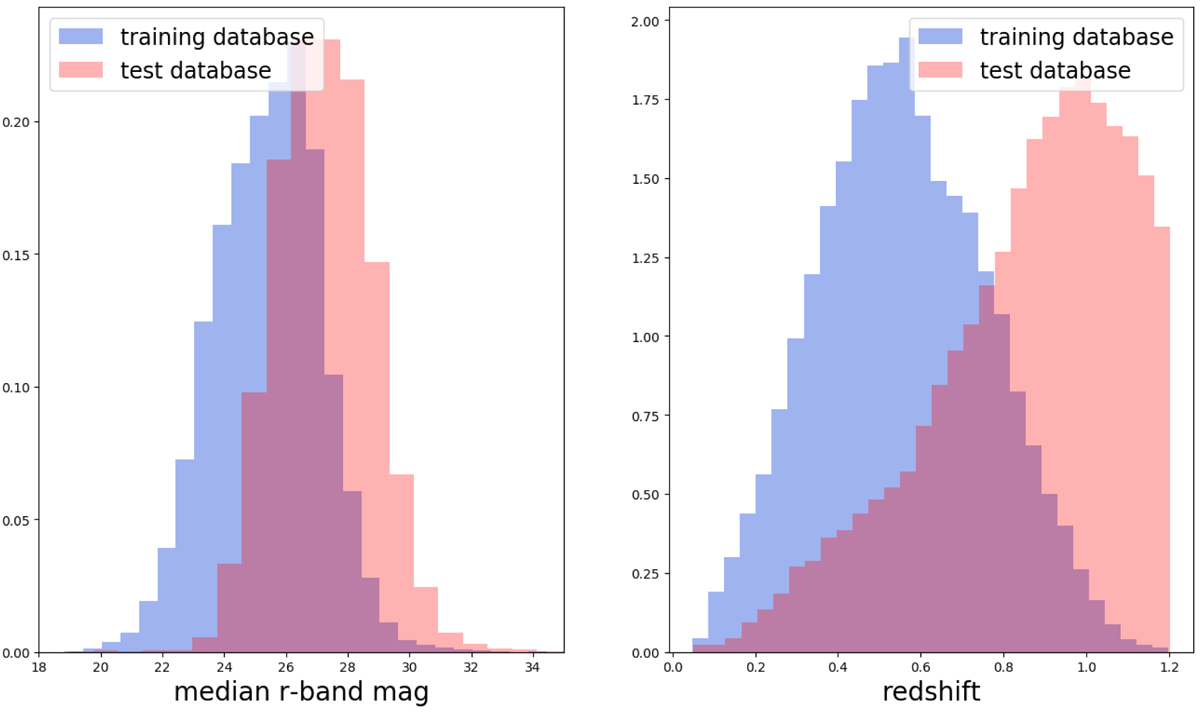
Distributions of LSST simulated data of the median r-band magnitude (left) and the simulated redshift (right) for the training dataset in blue and the test dataset in red. The mismatch is clearly visible as there is a significant shift between the two distributions.
Current usage metrics show cumulative count of Article Views (full-text article views including HTML views, PDF and ePub downloads, according to the available data) and Abstracts Views on Vision4Press platform.
Data correspond to usage on the plateform after 2015. The current usage metrics is available 48-96 hours after online publication and is updated daily on week days.
Initial download of the metrics may take a while.