Fig. 12.
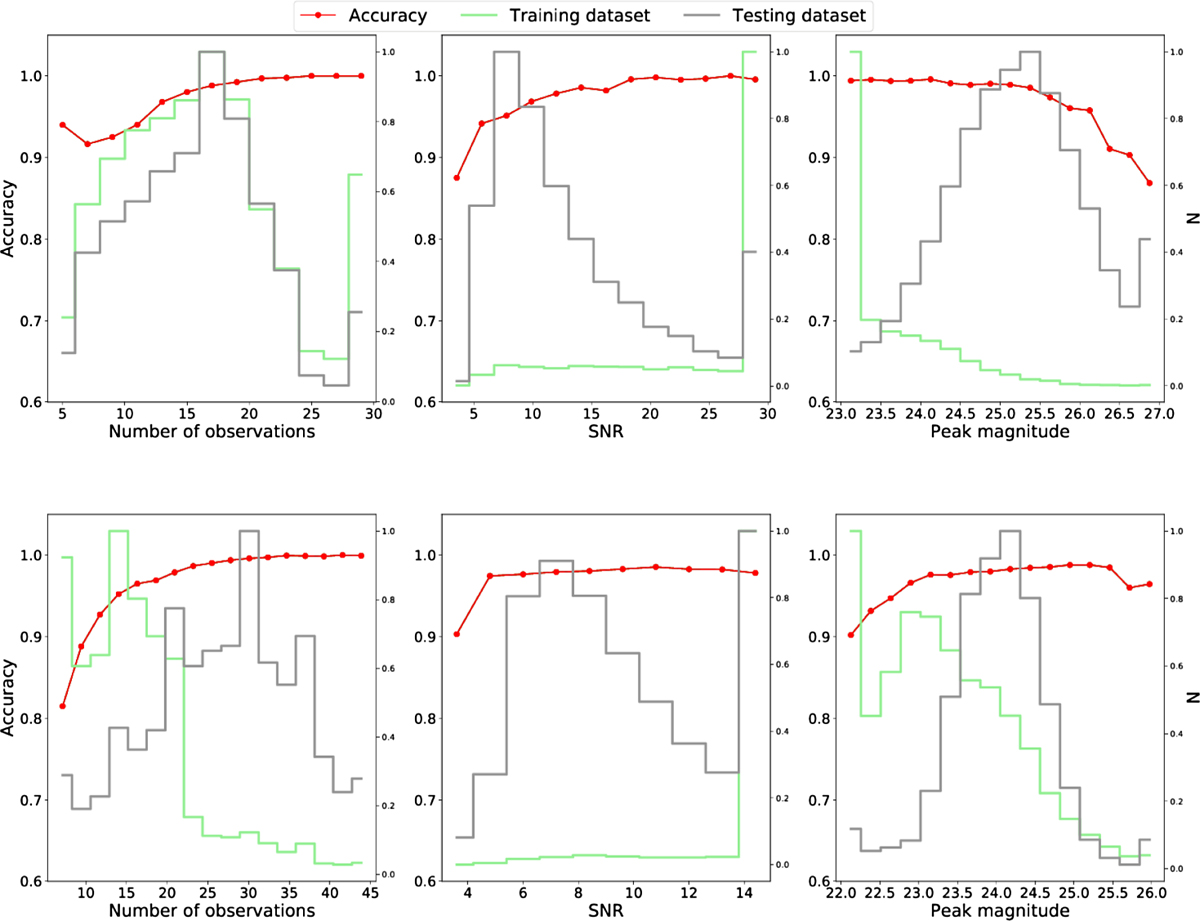
Upper panels: classification of DDF light curves and lower panels: classification of WFD light curves. Left panels: accuracy as a function of the total number of observations on different dates for all bands. Middle panels: accuracy as a function of S/N, which is computed as the maximum S/N from all bands. Right panels: accuracy as a function of peak magnitude, which corresponds to the maximum value of peak magnitude from all bands. For each case the distribution of the training database is represented in light green and that of the test database in gray.
Current usage metrics show cumulative count of Article Views (full-text article views including HTML views, PDF and ePub downloads, according to the available data) and Abstracts Views on Vision4Press platform.
Data correspond to usage on the plateform after 2015. The current usage metrics is available 48-96 hours after online publication and is updated daily on week days.
Initial download of the metrics may take a while.