Fig. 9.
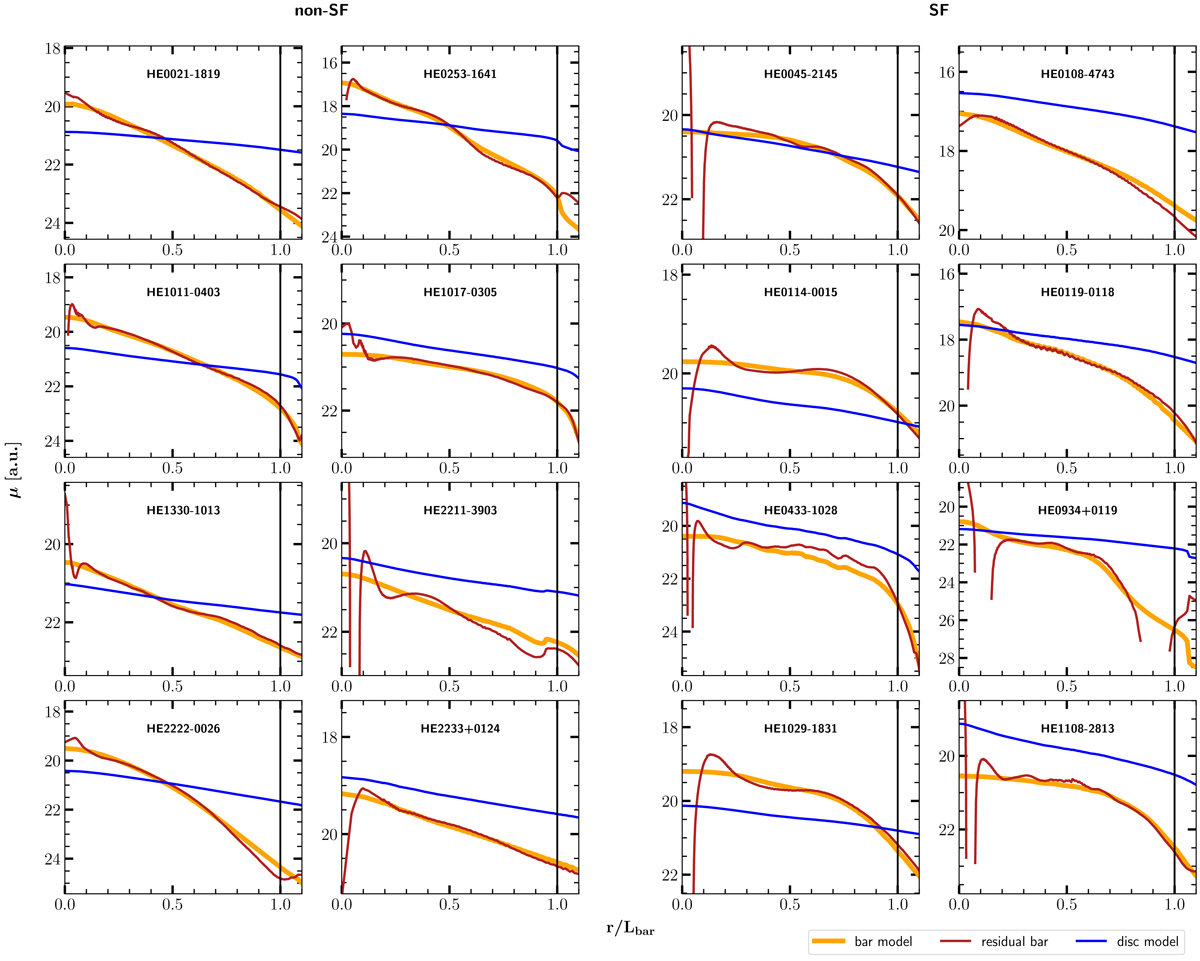
Residual surface brightness bar and disc profiles. On the x-axis we plot the radial distance from the centre of the galaxy along the bar major axis normalised by the bar length. The latter is shown by a vertical black line. On the y-axis we plot the surface brightness. The bar residuals are indicated in red. The orange line shows the surface brightness of the model bar component using a Sérsic profile. The blue line shows the exponential disc profile. All profiles were extracted from the 2D image using the ellipse fitting method. The subplots are grouped according to our classification into SF and non-SF bars.
Current usage metrics show cumulative count of Article Views (full-text article views including HTML views, PDF and ePub downloads, according to the available data) and Abstracts Views on Vision4Press platform.
Data correspond to usage on the plateform after 2015. The current usage metrics is available 48-96 hours after online publication and is updated daily on week days.
Initial download of the metrics may take a while.