Fig. 8.
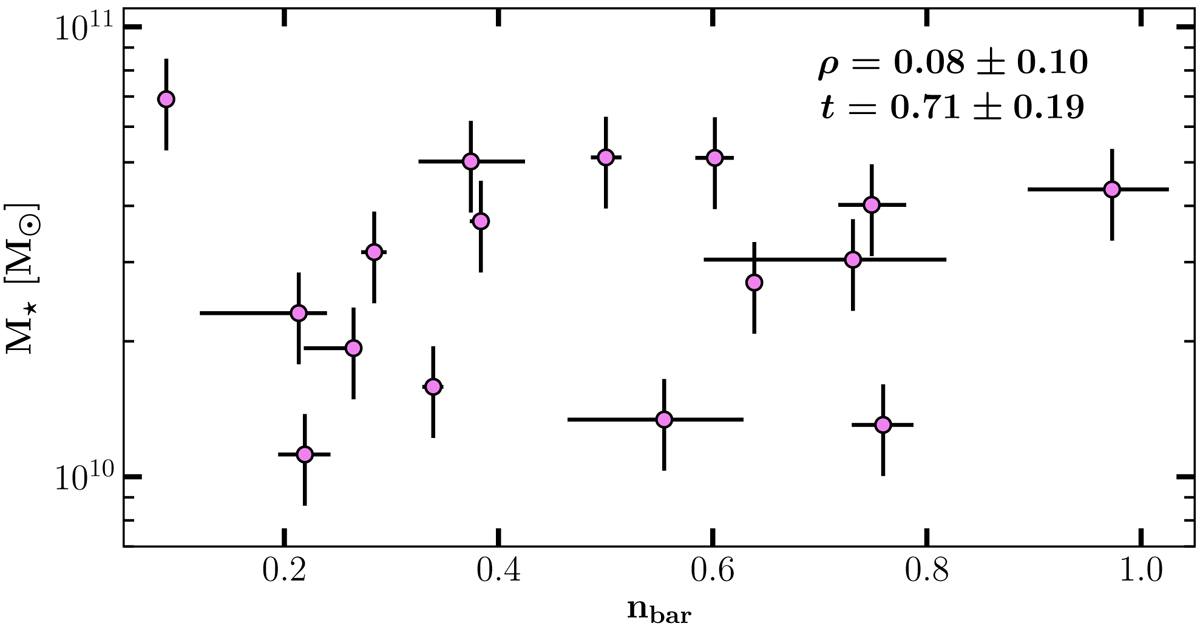
Comparison between total stellar mass and bar Sérsic index. Error bars show bootstrap errors on the x-axis and 0.1 dex uncertainties from the calibration in Taylor et al. (2011) on the y-axis. The Spearman’s rank correlation coefficient ρ and the t-value for a null-hypothesis test are given in the top right corner. The results show no indication for a correlation between the two parameters in the given mass range.
Current usage metrics show cumulative count of Article Views (full-text article views including HTML views, PDF and ePub downloads, according to the available data) and Abstracts Views on Vision4Press platform.
Data correspond to usage on the plateform after 2015. The current usage metrics is available 48-96 hours after online publication and is updated daily on week days.
Initial download of the metrics may take a while.