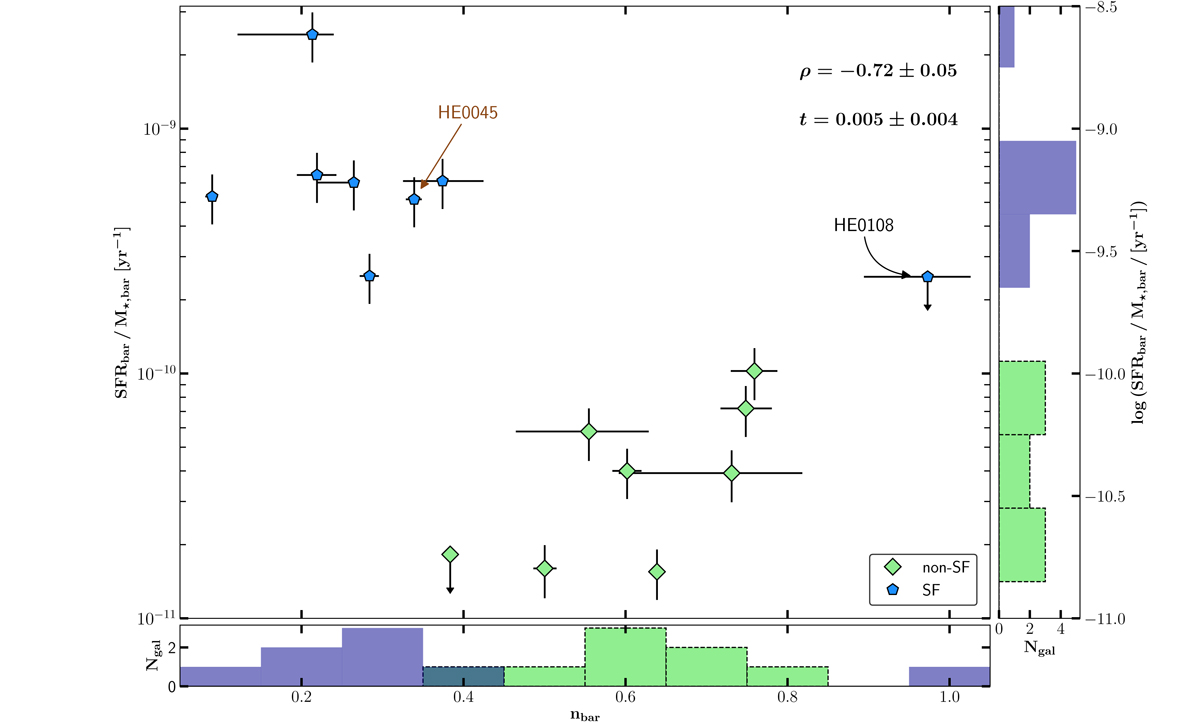
Fig. 7.
Comparison between the sSFR and the Sérsic index of the bar. The sbSFRb is the SFR normalised by the stellar mass of the bar in the intermediate bar region that includes the rows −3 to −1 and 1 to 3 as defined in Fig. 5. The index nbar is the Sérsic index of the main bar component bar1. The objects are divided into non-SF (green) and SF (blue) according to the classification in Fig. 6. Bottom and right panels: histograms for both parameters. There is a clear separation in log(sbSFRb) as we have seen before. The separation is also apparent in nbar with only marginal overlap. The galaxy HE 0108−4743 annotated in black is discussed separately in the text. HE 0045−2145 (indicated with a brown arrow) is the only galaxy not hosting an AGN in the sample. The error bars for nbar show the 68% confidence intervals from the posterior distribution of our bootstrap resampling method. More details about the uncertainties can be found in the main text and Appendix A.1. In the top right corner, we show the Spearman’s rank correlation coefficient ρ and the t-value for a null-hypothesis test.
Current usage metrics show cumulative count of Article Views (full-text article views including HTML views, PDF and ePub downloads, according to the available data) and Abstracts Views on Vision4Press platform.
Data correspond to usage on the plateform after 2015. The current usage metrics is available 48-96 hours after online publication and is updated daily on week days.
Initial download of the metrics may take a while.