Fig. 6.
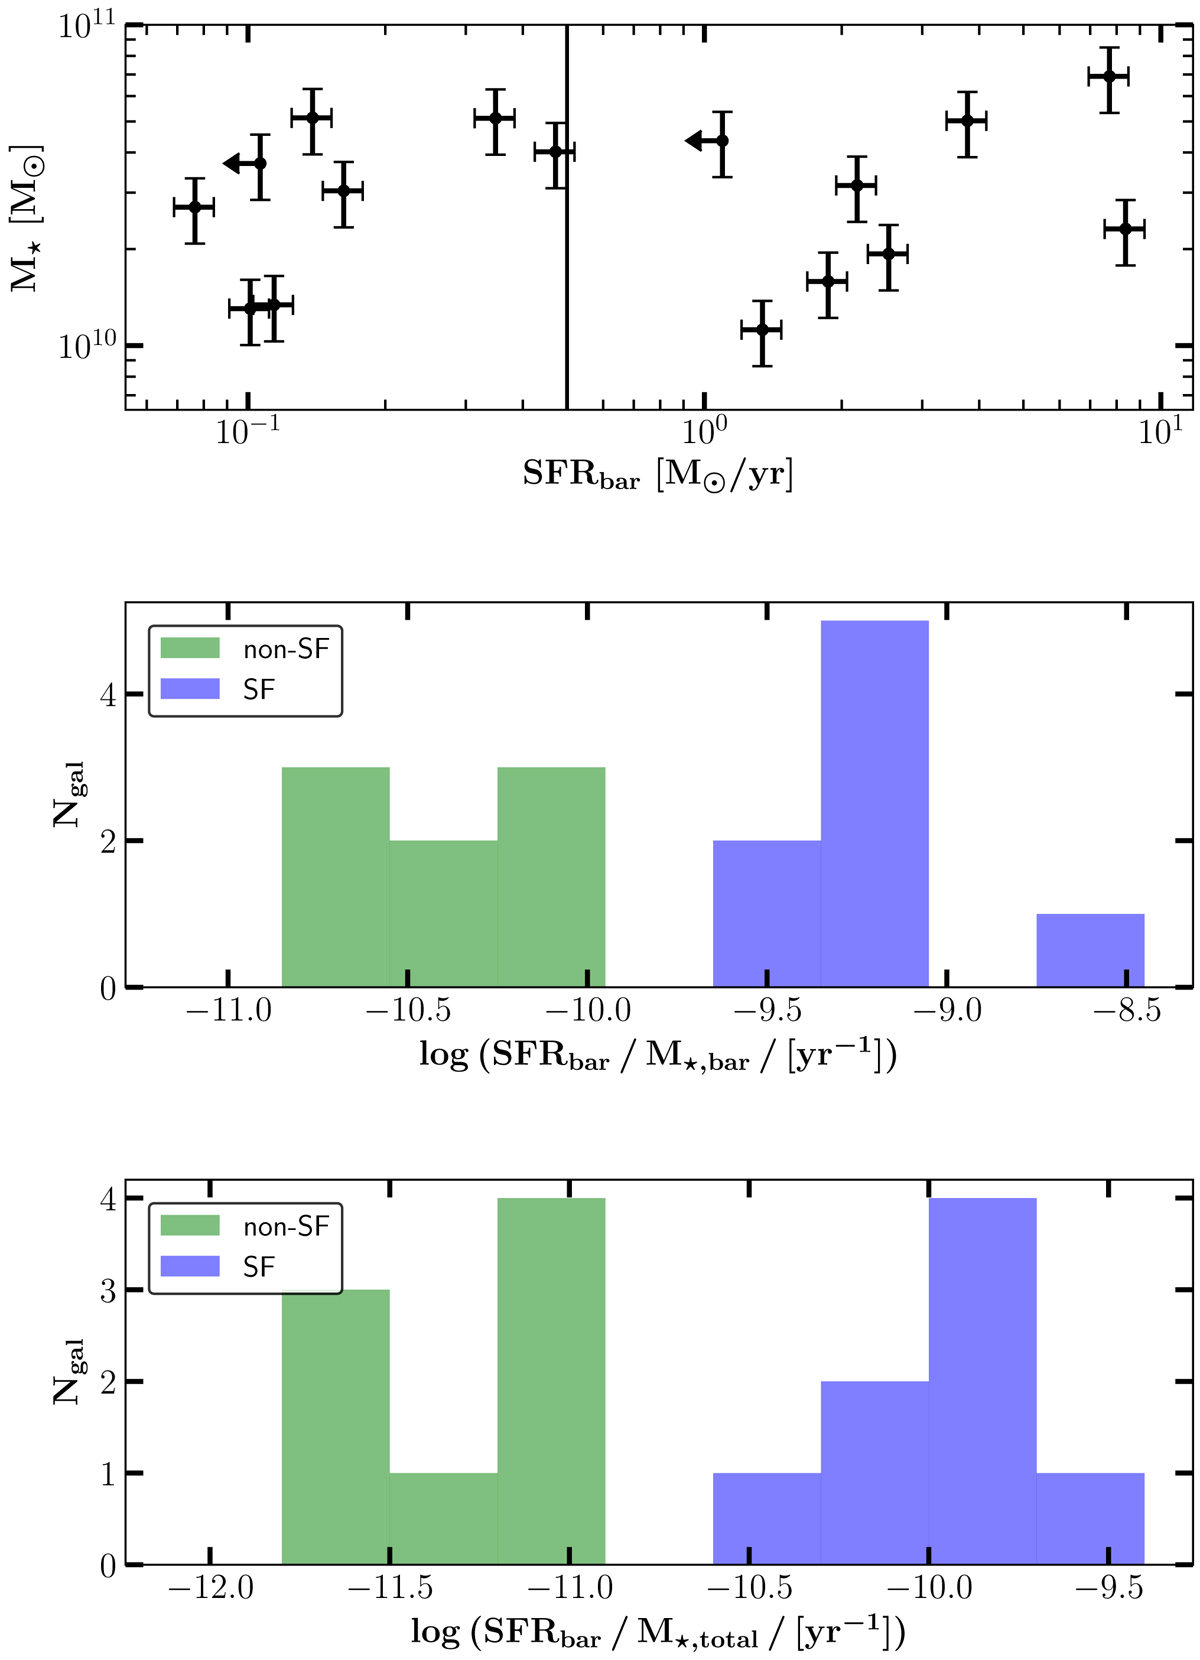
Total integrated SFRs in the intermediate bar region of each galaxy that includes the rows −3 to −1 and 1 to 3 as defined in Fig. 5. Upper panel: SFRb for each galaxy vs. total stellar mass. A separation between almost zero SFRs and SFRb ≳ 1 M⊙ yr−1 is clearly apparent. A vertical black line at SFRb = 0.5 M⊙ yr−1 shows our classification into SF and non-SF bars. Middle panel: histogram of sSFRs when accounting only for the mass of the bar. In light green and light blue we show non-SF and SF bars according to their location in the upper panel. Going from SFRb to sbSFRb does not change the separation. Lower panel: same as middle panel but dividing SFRb by the total stellar mass of the galaxy. Again, the classification does not change.
Current usage metrics show cumulative count of Article Views (full-text article views including HTML views, PDF and ePub downloads, according to the available data) and Abstracts Views on Vision4Press platform.
Data correspond to usage on the plateform after 2015. The current usage metrics is available 48-96 hours after online publication and is updated daily on week days.
Initial download of the metrics may take a while.