Fig. 5.
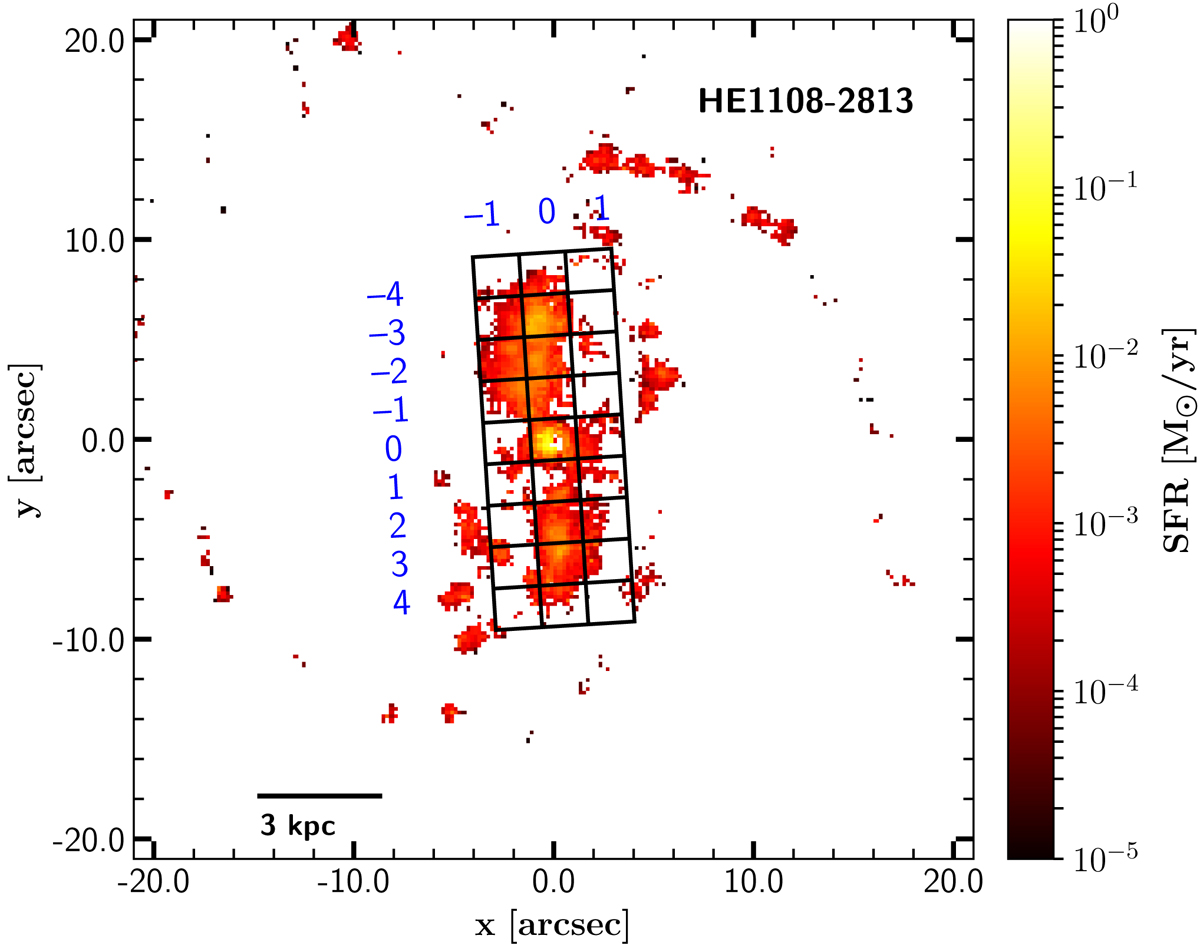
Spatially resolved map of SFRs in the galaxy HE 1108−2813. On top, we show the bar mask for that galaxy, created from the parameters of the image decomposition and ellipse fitting. The mask is divided into 3 × 9 subcells to analyse how the SFR changes over the bar region. A set of these maps for the complete sample with additional i-band contours can be found in Appendix D.
Current usage metrics show cumulative count of Article Views (full-text article views including HTML views, PDF and ePub downloads, according to the available data) and Abstracts Views on Vision4Press platform.
Data correspond to usage on the plateform after 2015. The current usage metrics is available 48-96 hours after online publication and is updated daily on week days.
Initial download of the metrics may take a while.