Fig. 4.
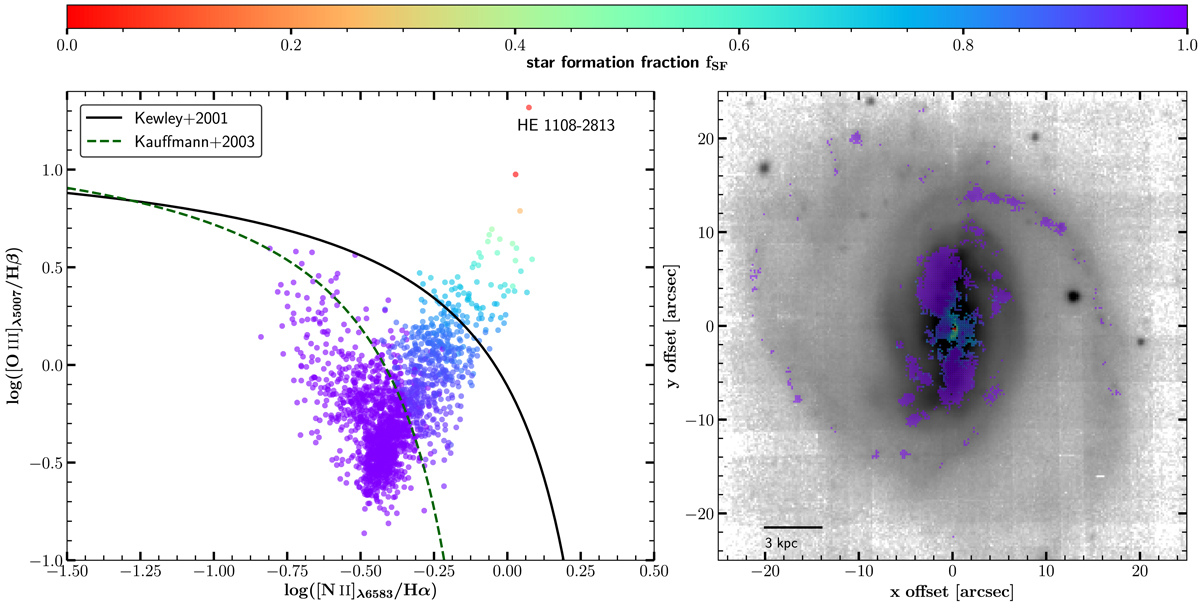
Left panel: emission line diagnostic for galaxy HE 1108−2813. Data points are coloured by the fraction of Hα that comes from star formation. The black solid line is adopted from the theoretical line from Kewley et al. (2001) and the green dashed line from the empirically derived separation from Kauffmann et al. (2003). We show only points where S/N > 3 for all four emission lines. Right panel: collapsed MUSE i-band image overplotted with the data points from the left panel to show the spatial location of these spectra.
Current usage metrics show cumulative count of Article Views (full-text article views including HTML views, PDF and ePub downloads, according to the available data) and Abstracts Views on Vision4Press platform.
Data correspond to usage on the plateform after 2015. The current usage metrics is available 48-96 hours after online publication and is updated daily on week days.
Initial download of the metrics may take a while.