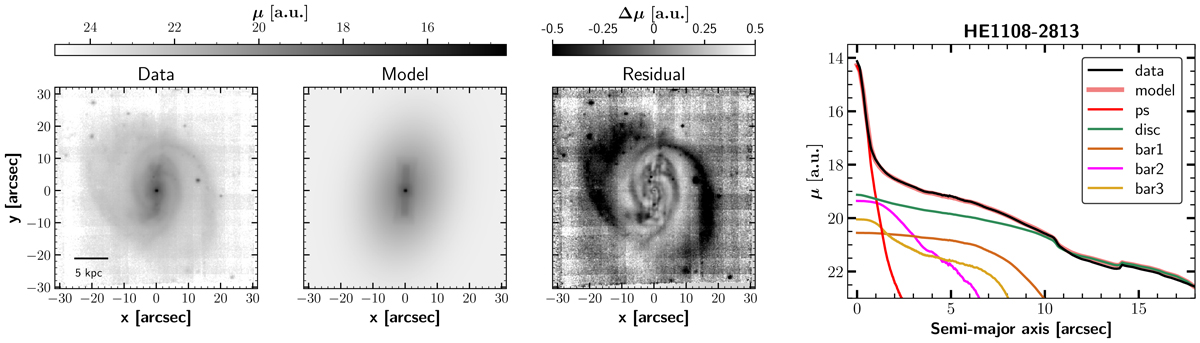
Fig. 2.
Photometric decomposition of MUSE collapsed i-band image of galaxy HE 1108−28138. From left to right: data image, model, residual=data-model, and surface brightness profile from isophotal fitting. The colour map in the residual image is stretched to show faint details. The surface brightness profiles in the right-most panel show a separation into all components that were included in the fit. The thick coral line shows the sum of all model components and the black line the observed data. A set of figures that shows the decomposition of the complete sample can be found in the Appendix C.
Current usage metrics show cumulative count of Article Views (full-text article views including HTML views, PDF and ePub downloads, according to the available data) and Abstracts Views on Vision4Press platform.
Data correspond to usage on the plateform after 2015. The current usage metrics is available 48-96 hours after online publication and is updated daily on week days.
Initial download of the metrics may take a while.